Starting a career in data analytics begins with understanding what you will learn in the course. A well-structured syllabus helps you build strong basics and move step by step toward advanced skills.
From data cleaning and Excel to SQL, Python, and data visualization, each subject plays an important role. In this guide, you’ll explore the complete data analytics course syllabus and subjects in a simple way.
What is Data Analytics?
Data analytics is the process of collecting, organizing, and analyzing raw data to find useful insights, patterns, and trends that help in better decision-making. It is widely used in businesses, healthcare, finance, and many other industries to improve performance and solve problems. Below are the types of data analytics:
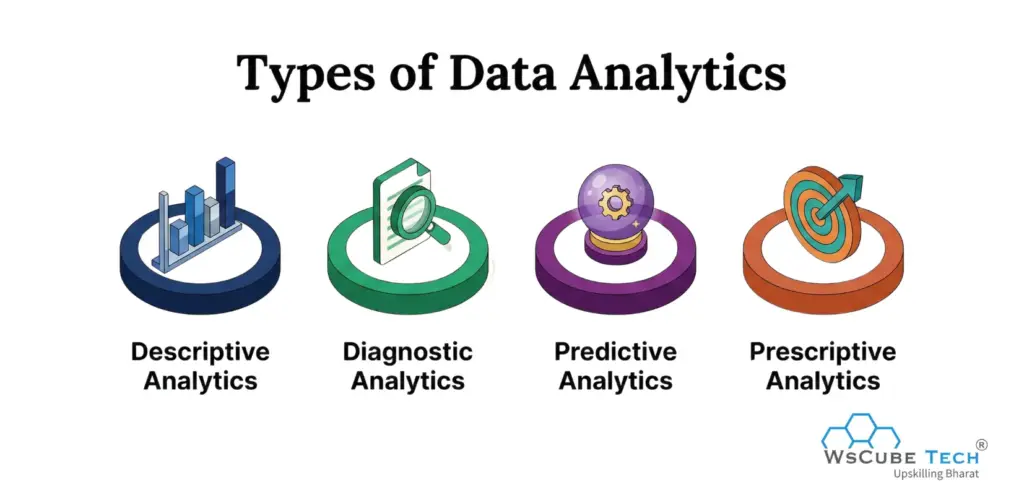
- Descriptive Analytics: Focuses on understanding past data and identifying what happened.
- Diagnostic Analytics: Identifies why something happened by analyzing data patterns.
- Predictive Analytics: Forecasts future outcomes using statistical models and machine learning.
- Prescriptive Analytics: Suggests actions and solutions based on data insights.
Data Analytics Course Syllabus (by WsCube Tech)
If you wish to enhance your data analytics skills, WsCube Tech’s Data Analytics courses will surely help you. To explore this, check the online data analytics course, which consists of 14 weeks of live online classes + 4 weeks of an online internship.
Core Subjects in Data Analytics
Below are the core data analytics subjects that are important to become a successful data analyst:
1. Statistics and Mathematics for Data Analytics
Statistics and mathematics form the foundation of data analytics. You learn concepts like probability, mean, median, standard deviation, and basic calculus. These topics help you analyze data, identify patterns, and make accurate predictions. A strong understanding of these concepts is essential for building analytical skills and making data-driven decisions in real-world scenarios.
2. Python/R Programming
Python and R are widely used programming languages in data analytics. Python is popular for its simplicity and powerful libraries such as Pandas, NumPy, and Matplotlib, while R is primarily used for statistical analysis and data visualization. Learning these languages helps you clean, analyze, and visualize data efficiently, making them essential tools for every data analyst.
3. SQL (Structured Query Language)
SQL is used to manage and retrieve data from databases. You learn queries like SELECT, WHERE, JOIN, and GROUP BY. It helps in extracting meaningful information from large datasets. SQL is an important skill for working with relational databases in real-world data analytics projects.
4. Data Visualization
Data visualization helps you present data in a clear and meaningful way using charts, graphs, and dashboards. Tools like Power BI and Tableau are commonly used. It allows you to communicate insights effectively and make data easy to understand for decision-makers.
5. Excel for Data Analytics
Excel is a basic yet powerful tool for data analysis. You learn functions, pivot tables, charts, and data cleaning techniques. It is widely used for quick analysis, reporting, and dashboard creation. Excel is often the first step for beginners in data analytics.
6. Machine Learning
Machine learning introduces you to algorithms that allow systems to learn from data. You learn models like linear regression, decision trees, and clustering. It helps in making predictions and identifying patterns. Basic ML knowledge enhances your ability to perform advanced data analysis.
7. Data Cleaning & Preprocessing
Data cleaning is the process of preparing raw data for analysis. You learn how to handle missing values, remove duplicates, and correct errors. Clean data ensures accurate results and better insights. It is one of the most important steps in the data analytics process.
8. Business Analytics & Problem Solving
This subject focuses on applying data analysis to solve real business problems. You learn how to interpret data, identify trends, and make strategic decisions. It improves your ability to connect data insights with business goals and outcomes.
9. Big Data Basics
Big Data involves handling large and complex datasets. You learn about tools and technologies used to process big data. It helps you understand how companies manage and analyze large volumes of data to make better decisions.
10. Real-world Projects and Case Studies
Projects and case studies help students apply theoretical knowledge to real-world business problems. This subject focuses on hands-on practice, data interpretation, dashboard building, and the presentation of actionable insights using real datasets.
So, these are the core data analytics course subjects that help build strong analytical, technical, and problem-solving skills required to become a successful data analyst.
Recommended Professional Certificates
Data Analytics Mentorship Program
Data Science & AI Mentorship Program
Skills Required to Become a Data Analytics Professional
To become a successful data professional, you need a combination of technical expertise and soft skills. Below are the key technical and non-technical data analytics skills required to build a strong career in this field:
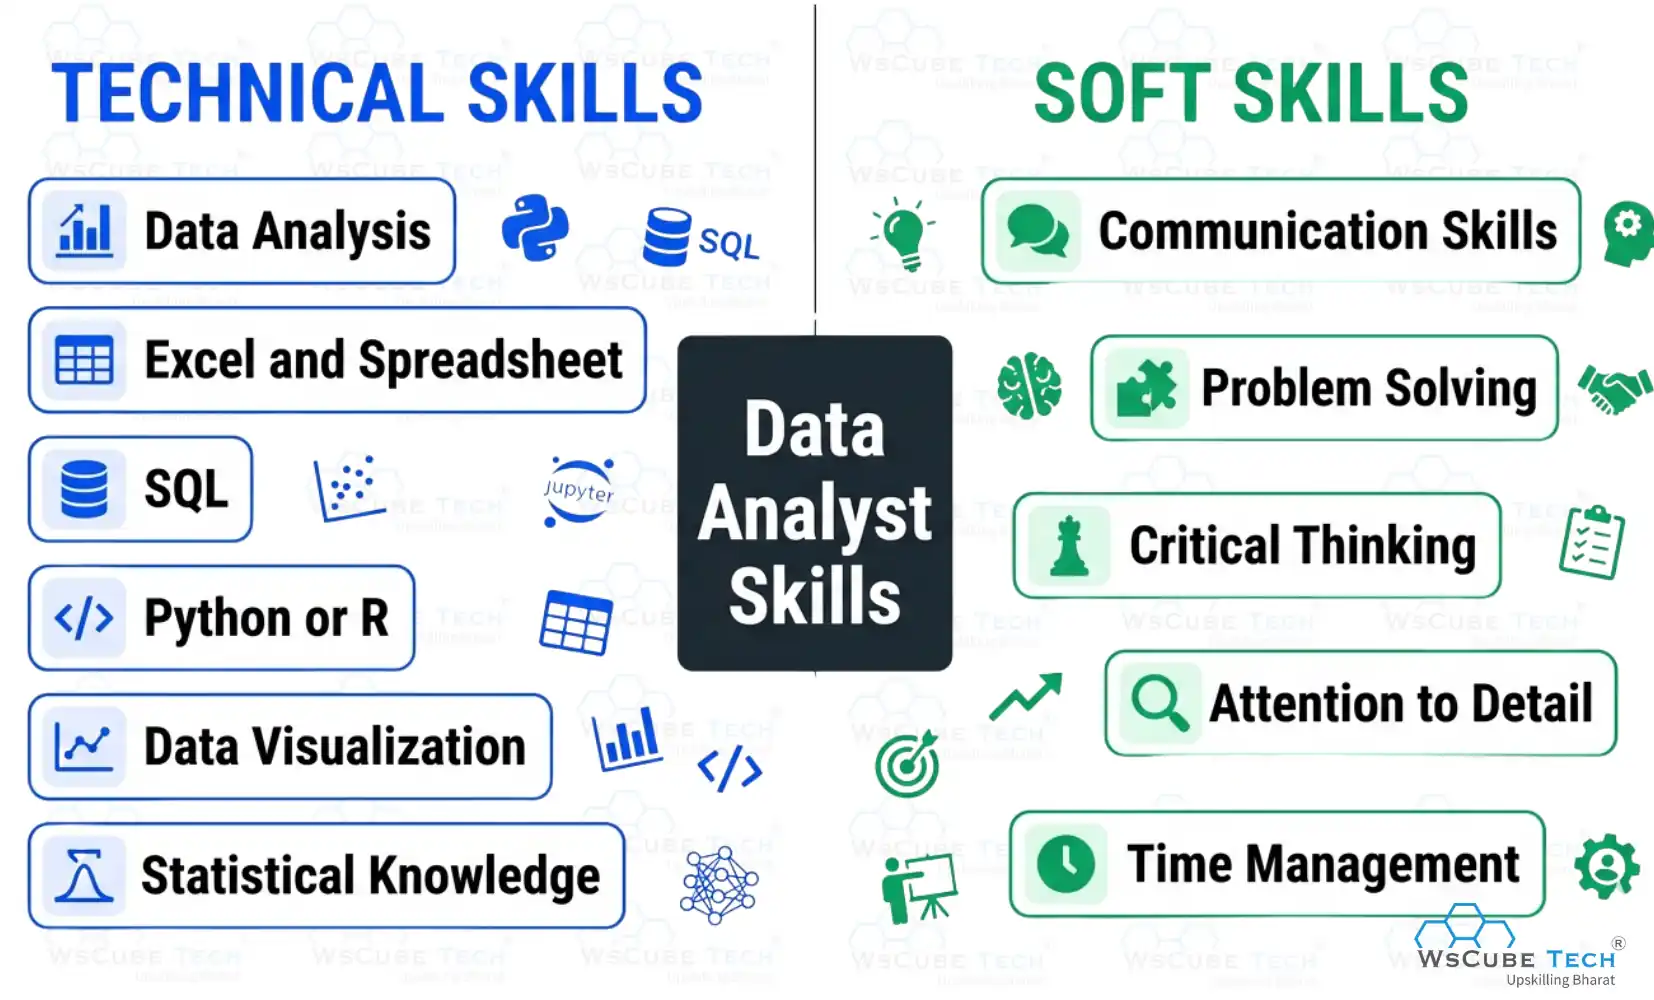
Technical Skills
- Excel and Spreadsheet Analysis
- Programming Skills (Python, SQL, R)
- Statistical Analysis
- Data Cleaning and Preprocessing
- Data Visualization
- Dashboard Creation (Power BI / Tableau)
- Database Management
- SQL Query Writing
- Basic Machine Learning
- Business Intelligence Tools
Soft Skills
- Analytical Thinking
- Problem-Solving Skills
- Communication Skills
- Critical Thinking
- Business Understanding
- Teamwork and Collaboration
- Decision-Making Skills
- Attention to Detail
Data Analytics Course Eligibility
The eligibility for a data analytics course depends on the course level, such as undergraduate, postgraduate, diploma, or certification. Most institutes in India prefer candidates with a background in mathematics, statistics, computer science, commerce, or engineering, though beginner certification and online courses are often open to students from any stream.
| Course Level | Eligibility Criteria |
| Undergraduate | 10+2 pass from a recognized board. Mathematics is preferred. Most institutes require a minimum of 50–60% marks. |
| Postgraduate | Bachelor’s degree in any relevant field such as mathematics, statistics, computer science, commerce, or engineering with at least 50–60% marks. |
| PG Diploma / Certification | Bachelor’s degree in any stream. Basic knowledge of Excel, statistics, or programming is preferred but not mandatory. |
| Online / Short-Term Certification | Open to students, graduates, and working professionals from any academic background |
Important Requirements
- Mathematics or Statistics background preferred
- Basic knowledge of Excel, Python, or SQL
- Analytical and logical thinking skills
- Minimum 50–60% marks in previous qualification
- Some colleges or institutes may require entrance exams
Distance Education in Data Analytics
Distance education in data analytics has become a popular choice for learners who want to acquire industry-relevant skills with flexibility and convenience. It allows you to study from anywhere and manage your learning schedule according to your work, college, or personal commitments. This mode is ideal for both beginners and working professionals.
Most distance learning programs cover important topics such as data analysis concepts, statistical methods, programming basics, database handling, and data visualization tools. Many courses also include practical assignments, case studies, and project work to provide hands-on experience.
With online lectures, recorded sessions, study materials, and certification support, distance education in data analytics helps you build job-ready skills and improve career opportunities in the growing analytics field.
Upcoming Masterclass
Attend our live classes led by experienced and desiccated instructors of Wscube Tech.


Data Analytics Course Fees
Data analytics course fees depend on the type and level of the course you choose. Certification and diploma courses are generally more affordable, while undergraduate and postgraduate degree programs may have higher fees depending on the institute, duration, and facilities provided.
| Course Type | Approximate Fees |
| Certification Course (Online/Short-term) | ₹5,000 – ₹10,000 |
| Diploma Course | ₹9,300 – ₹2,00,000 |
| Undergraduate Course | ₹90,000 – ₹21,00,000 |
| Postgraduate Course | ₹20,000 – ₹23,00,000 |
The fee structure may vary based on course duration, institute reputation, mode of delivery (online or offline), practical projects, study materials, placement support, and access to learning portals. Some institutes may also offer discounts, scholarships, or installment options to make the course more affordable.
If you are interested in joining an online certification program, WsCube Tech offers a data analytics mentorship program that helps you become a job-ready Data Analyst in 14 weeks. These programs focus on practical skills, real-world projects, and career support to help you start your career with confidence.
Books to Learn Data Analytics
Here are the best books to learn data analytics, from beginner to advanced level, that are widely recommended by professionals and learning platforms:
1. Data Analytics Made Accessible – Anil Maheshwari
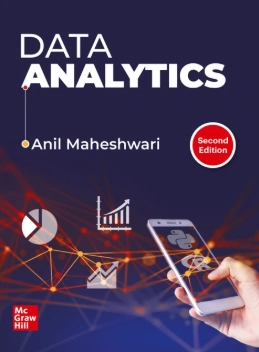
This is one of the best beginner-friendly books for learning data analytics concepts in a simple and easy-to-understand way. It covers the fundamentals of data analysis, business applications, and practical use cases, making it highly suitable for students and beginners.
2. Storytelling with Data – Cole Nussbaumer Knaflic
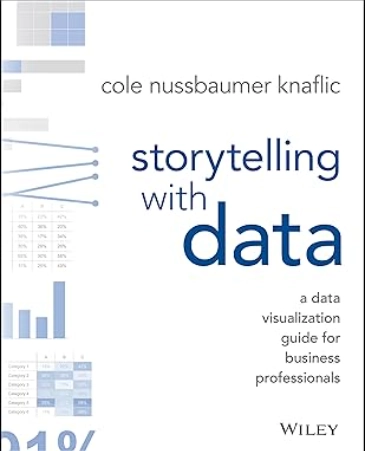
One of the best books for learning data visualization and dashboard storytelling. It teaches how to present insights clearly using charts, graphs, and business dashboards.
3. An Introduction to Statistical Learning – Gareth James et al.
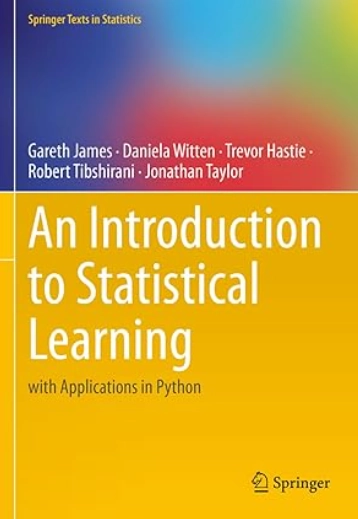
Best for advanced learners who want to understand concepts in machine learning, regression, classification, and predictive analytics, with practical examples.
4. Python Data Science Handbook – Jake VanderPlas
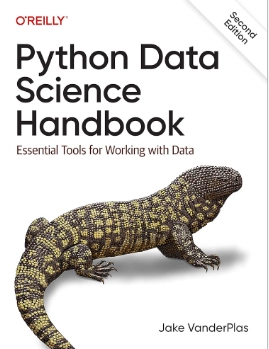
One of the best books for learning NumPy, Pandas, Matplotlib, and Scikit-learn. It is highly practical and perfect for beginners who want hands-on Python-based data analytics learning.
5. Practical Statistics for Data Scientists – Peter Bruce & Andrew Bruce
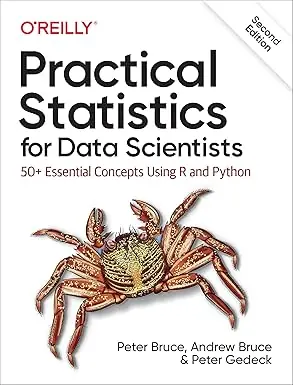
This book is ideal for learning the statistics and probability concepts required in data analytics, including hypothesis testing, distributions, and real-world statistical methods.
Data Analytics Course Benefits
Data analytics courses provide you with the essential skills and knowledge to interpret and analyze data effectively. Here are some key benefits of taking a data analytics course:
1. Learn Essential Data Analysis Tools and Techniques
You learn essential tools and technologies like Excel, SQL, Python, and R, which are widely used in the industry. These tools help you collect, clean, analyze, and visualize data efficiently. Gaining hands-on experience with these tools makes you more skilled and job-ready.
2. Develop Critical Thinking and Problem-Solving Skills
Data analytics involves analyzing complex data and finding meaningful insights. You develop strong analytical thinking and problem-solving abilities, which help you make data-driven decisions. These skills are valuable in multiple industries and improve your overall career opportunities.
3. Gain Industry-Relevant Knowledge
The course provides practical knowledge of how data analytics is used in real-world industries like finance, healthcare, marketing, and IT. You learn how to solve business problems using data, which helps you stand out and become more valuable to employers.
4. Improve Career Opportunities and Earning Potential
Data analytics is a high-demand field with excellent career growth. After completing the course, you can apply for roles like data analyst, business analyst, or BI analyst. Skilled professionals often receive competitive salaries and better job opportunities across industries.
Read More Guides Related to Data
Career Opportunities After Data Analytics Course
Data analytics offers many career paths across industries with high demand, strong growth, and excellent opportunities for skilled professionals. Below are the major career opportunities after completing a data analytics course:
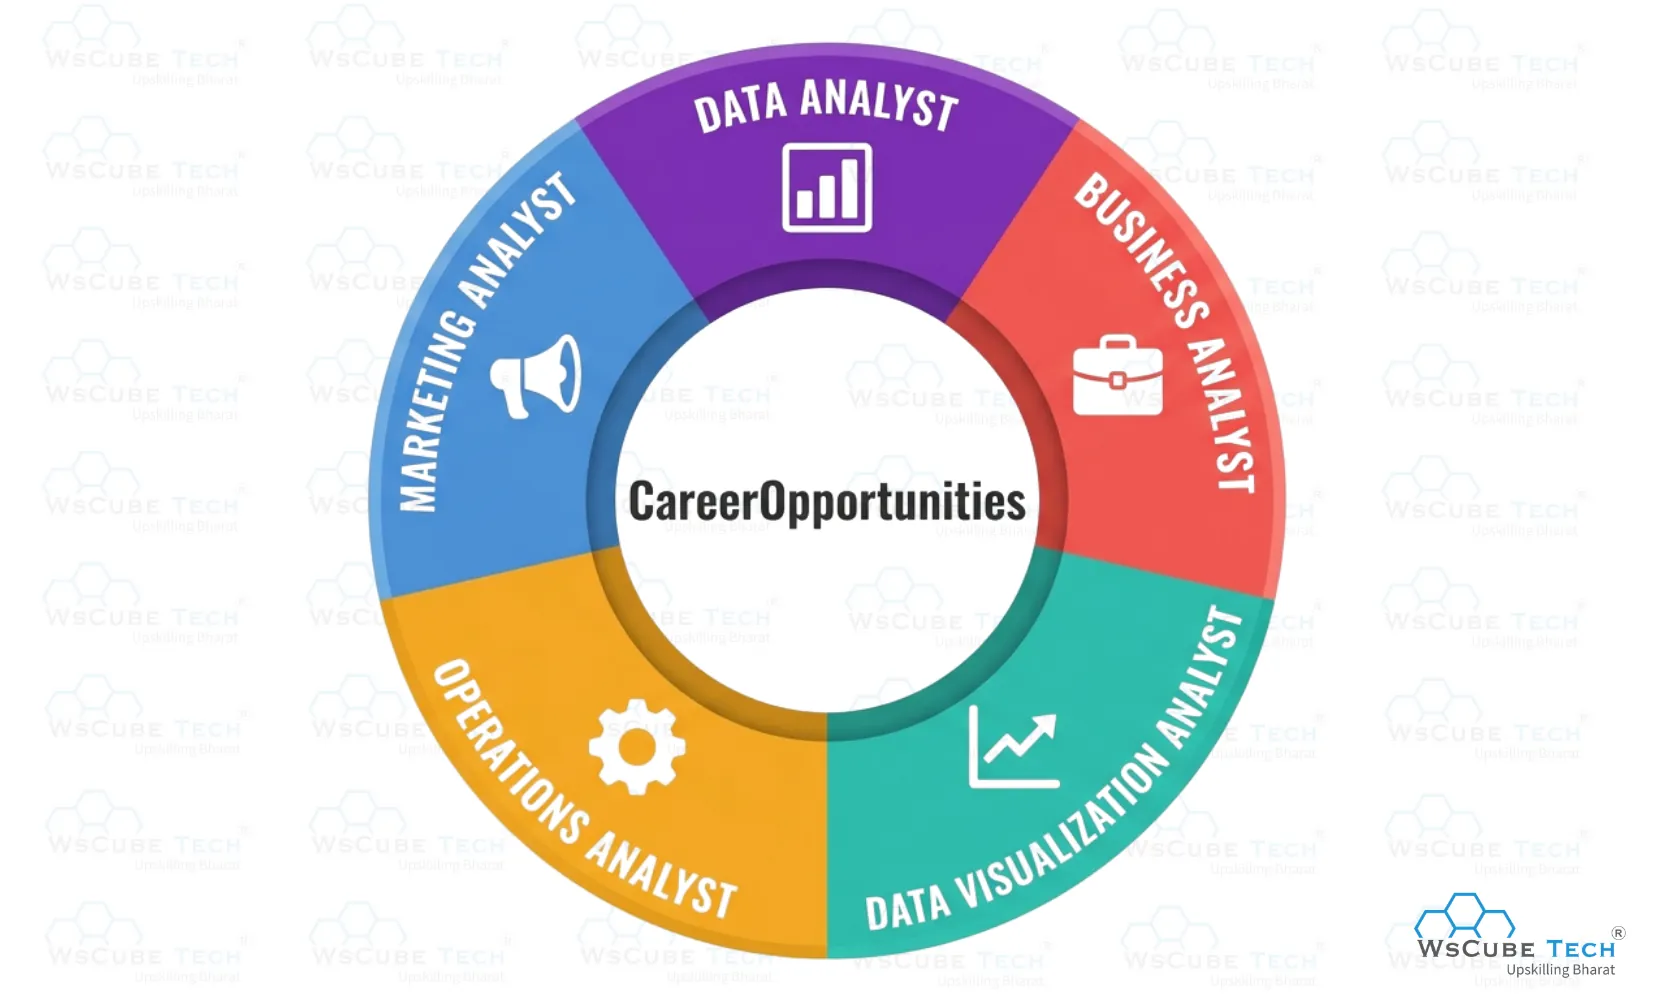
- Data Analyst: Collects, cleans, and analyzes data to identify trends and patterns. Creates reports, dashboards, and visual insights that help organizations make informed business decisions and improve overall performance.
- Business Analyst: Uses data insights to understand business requirements, identify challenges, and suggest effective solutions. Helps connect data-driven findings with business goals and strategies.
- Business Intelligence Analyst: Builds dashboards, reports, and KPI visualizations using tools like Power BI and Tableau to support strategic decision-making and performance tracking.
- Data Visualization Analyst: Focuses on presenting complex data through charts, graphs, dashboards, and reports that are easy for stakeholders and management to understand.
- Financial Analyst: Analyzes financial data, market trends, and company performance to support investment decisions and financial planning. Uses data analytics techniques to forecast revenue and reduce financial risks.
- Marketing Analyst: Evaluates marketing campaigns, customer behavior, and sales data to improve marketing strategies. Helps businesses understand customer preferences and optimize campaigns for better results.
- Operations Analyst: Uses data to improve business operations, efficiency, and productivity. Analyzes workflows, identifies issues, and suggests data-driven solutions to enhance performance and reduce costs.
- Risk Analyst: Assesses potential risks in business processes, finance, or operations using data analysis. Helps organizations minimize risks by identifying patterns and making preventive strategies.
- Junior Data Scientist / Analytics Associate: Works on data modeling, basic machine learning, and advanced analysis tasks. Supports data science teams by preparing data, building models, and generating insights for business growth.
Top Recruiters in Data Analytics:
| Amazon | Microsoft | Accenture | |
| TCS | Infosys | Wipro | IBM |
| Deloitte | Ernst & Young (EY) | Capgemini | HCL |
| Flipkart | Reliance | JPMorgan Chase | Barclays |
Also Read: Data Analyst vs. Data Scientist: Key Differences & Comparison
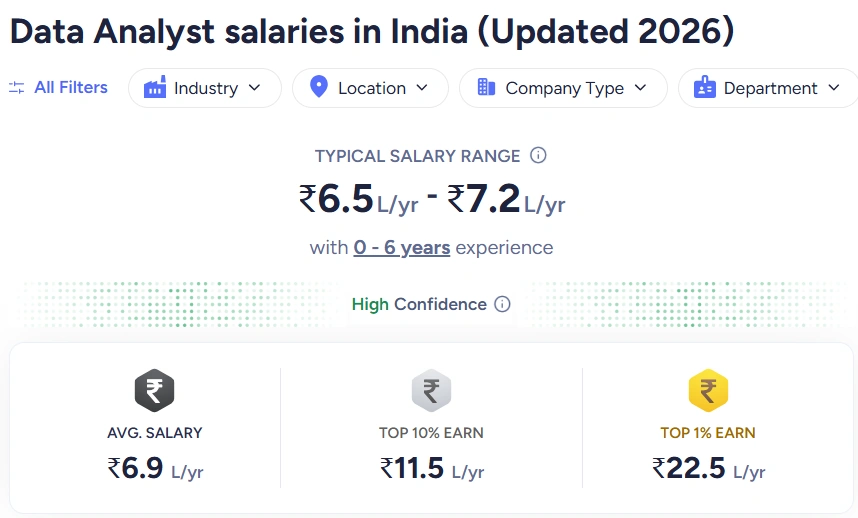
Salary of a Data Analyst in India
Data analytics is one of the fastest-growing and well-paying career fields in India, with average salaries ranging from ₹6.5 lakhs to ₹7.2 lakhs per annum for professionals who have strong technical skills, hands-on project experience, and relevant industry knowledge.
Start Learning With Our Free Tutorials
| Python Tutorial | Java Tutorial | JavaScript Tutorial |
| C Tutorial | C++ Tutorial | HTML Tutorial |
| CSS Tutorial | SQL Tutorial | DSA Tutorial |
Future Scope of Data Analytics
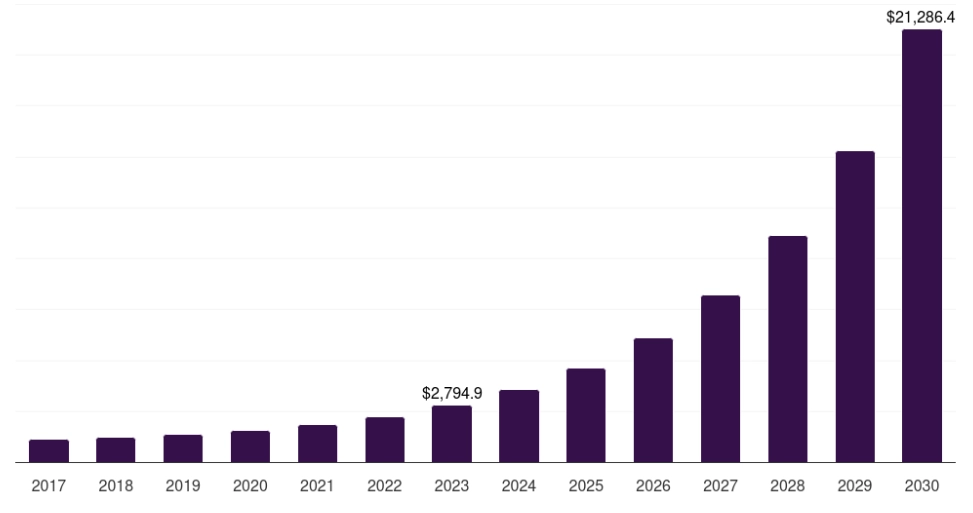
The future of data analytics in India is growing rapidly as organizations across industries increasingly rely on data-driven decision-making. The Indian data analytics market was valued at approximately USD 3,551.8 million in 2024 and is projected to reach around USD 21,286.4 million by 2030, showing significant growth in the coming years.
The market is expected to grow at a strong CAGR of 35.8% from 2025 to 2030, highlighting excellent career opportunities, rising industry demand, competitive salaries, and long-term career stability in data analytics.
Is Data Analytics a Good Career in India?
Data analytics is one of the fastest-growing and most promising career options in India today. As companies across IT, finance, healthcare, e-commerce, and marketing rely more on data to make smart decisions, the demand for skilled data professionals is increasing rapidly.
So, is data analytics a good career? Absolutely. It offers high salary potential, strong job security, and excellent growth opportunities. Even beginners can start with a good salary, and with experience, you can move into advanced roles like data scientist or analytics manager.
What makes this field even better is that it is open to both technical and non-technical backgrounds. With the right skills, tools, and practical experience, anyone can enter this field and grow. If you’re looking for a career that is in demand, future-ready, and full of opportunities, data analytics is definitely a smart choice.
FAQs About Data Analytics Syllabus
A data analytics course syllabus includes Excel, SQL, Python or R, statistics, data visualization, and basic machine learning. It also covers data cleaning, data processing, and real-world projects for practical learning experience.
Coding is not always mandatory for beginners, but learning programming languages like Python or R becomes important for advanced analysis. Basic coding knowledge helps you work efficiently with large datasets and automation tasks.
Python is considered the best programming language for data analytics due to its simplicity and powerful libraries. R is also popular for statistical analysis and data visualization, especially in research-based projects.
Basic mathematics is important for data analytics, especially topics like statistics, probability, and algebra. However, advanced mathematics is not always required, and beginners can learn concepts step by step during the course.
Important tools include Excel, SQL, Python, Power BI, and Tableau. These tools help in data cleaning, analysis, and visualization, making it easier to present insights and support data-driven decision-making in organizations.
The duration of a data analytics course varies based on the course type. Certification courses usually take around 2 to 6 months, while diploma and degree programs can take 1 to 3 years to complete.
Yes, most data analytics courses include SQL and database management. You learn how to store, retrieve, and manage data efficiently using queries, which is essential for working with structured datasets in real-world projects.
Yes, data visualization is an important part of the syllabus. You learn tools like Power BI and Tableau to create charts, dashboards, and reports that help present data clearly and effectively to stakeholders.
After completing a data analytics course, you can work as a data analyst, business analyst, BI analyst, or junior data scientist. These roles are in high demand across industries like IT, finance, healthcare, and marketing.
To succeed in data analytics, you need analytical thinking, basic mathematics, problem-solving skills, and knowledge of tools like Excel, SQL, and Python. Communication skills are also important for presenting data insights effectively.
Conclusion
Data analytics has become one of the fastest-growing career fields in India, with strong demand across industries and excellent long-term career opportunities. As businesses continue to rely on data for smarter decisions, the need for skilled professionals is expected to grow rapidly in the coming years.
Whether you are a beginner, graduate, or working professional, this field offers great career growth, competitive salaries, and job stability. With the right learning path and practical experience, data analytics can be a highly rewarding and future-ready career choice.
Join Our On-Campus Data Analytics Course


Leave a comment
Your email address will not be published. Required fields are marked *Comments (0)
No comments yet.