Every day, you create data when you shop online, use social media, search on the internet, or make digital payments. Companies, banks, hospitals, and many other organizations also generate large amounts of data through their daily operations. This continuous flow of information keeps increasing, making it difficult to understand what is truly important.
The main challenge is not collecting this data but making sense of it in a meaningful way. Organizations need a proper method to study the information and use it to improve decisions, reduce risks, and plan better strategies. For that problem, the solution is Data Analytics.
What is Data Analytics?
Data Analytics is the process of studying raw data to find useful information that can help you make better decisions. When you collect data from websites, apps, sales reports, surveys, or business systems, it does not automatically give clear answers.
It needs to be organized, checked, and examined carefully. Data Analytics provides a structured way to do this so that the information becomes meaningful and practical.
Data Analytics usually includes the following activities:
- Data Collection: Gathering data from different sources such as databases, websites, sensors, or business applications.
- Data Cleaning: Removing errors, duplicate values, or missing information to ensure accuracy.
- Data Processing: Organizing and structuring the data into a usable format.
- Data Analysis: Applying statistical or logical methods to identify patterns and relationships.
- Data Interpretation: Explaining the results in a clear manner so that decisions can be made.
Planning to start a career in data analytics? Join our online data analytics course and gain the skills you need to succeed.
Importance of Data Analytics
Now that we understand what Data Analytics is, the next step is to understand why it plays such an important role in real-life situations and business decision-making.
Below are some important reasons that explain its practical value and impact.
- Better Decision-Making: Data analytics provides clear insights into trends, patterns, and performance. With accurate information, you can choose strategies that are practical and result-oriented.
- Improved Operational Efficiency: By analyzing workflows and system performance, you can identify delays, errors, or resource wastage. This helps you improve processes and reduce unnecessary costs.
- Enhanced Customer Understanding: Data analytics allows you to study customer behavior, preferences, and feedback. This helps you create better products, improve services, and build stronger relationships.
- Risk Identification and Management: Through data analysis, you can detect unusual patterns or warning signs early. This supports better risk control and reduces the chance of unexpected losses.
- Competitive Advantage: Organizations that use data effectively can respond faster to market changes. This makes it easier to plan strategically and stay ahead of competitors.
Recommended Professional Certificates
Data Analytics Mentorship Program
Data Science & AI Mentorship Program
Types of Data Analytics
As discussed above, data analytics improves decisions, customer understanding, risk control, and competitiveness. To achieve these results effectively, different types of data analysis are applied based on the specific goal.
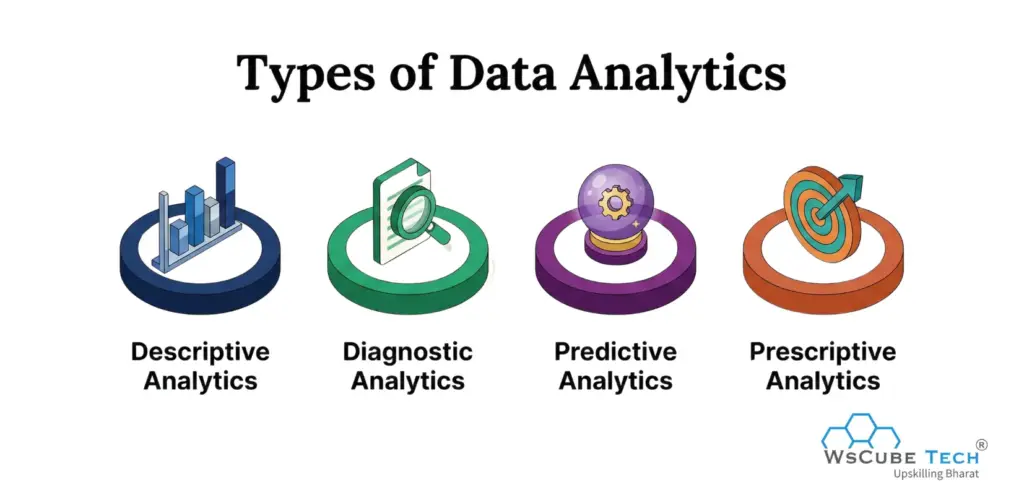
Data Analytics is divided into four different types:
- Descriptive Analytics
- Diagnostic Analytics
- Predictive Analytics
- Prescriptive Analytics
1. Descriptive Analytics
Descriptive Analytics focuses on answering one basic question: What has happened?
It studies past data and presents it in a structured format so that performance and trends can be clearly understood. This type of analysis does not explain causes or suggest future actions. Its purpose is to summarize historical information in a meaningful way.
Purpose of Descriptive Analytics
The main objective is to organize and present past data so that patterns and outcomes become easy to see. It helps you understand performance over a specific time period.
How Descriptive Analytics Works:
- Collect Historical Data: Data is gathered from sources such as sales systems, websites, financial records, or customer databases.
- Clean and Organize Data: Errors, duplicates, and missing values are removed. The data is arranged in tables or structured formats.
- Summarize the Data: Basic calculations such as totals, averages, percentages, and counts are applied.
- Present Results: The summarized data is displayed using reports, charts, dashboards, or graphs.
Example
- A company may generate a monthly sales report showing total revenue, number of products sold, and sales by region.
- A website owner may track daily visitors, page views, and user activity.
- A bank may review quarterly transaction summaries.
Importance of Descriptive Analytics
- Provides a clear view of past performance
- Helps in tracking progress and trends
- Forms the base for advanced analysis
- Supports simple and structured reporting
In simple terms, Descriptive Analytics converts raw historical data into clear summaries that help you understand past results and overall performance.
Also Read: Top 10 Best Big Data Analytics Tools & Software
2. Diagnostic Analytics
Diagnostic Analytics focuses on answering one important question: Why did it happen?
After identifying what has occurred through descriptive analysis, the next step is to understand the reason behind that result.
Purpose of Diagnostic Analytics
The main objective is to identify the root cause of a problem or a sudden change in performance. It helps you move from simple reporting to detailed investigation.
How Diagnostic Analytics Works:
- Identify the Issue: A problem or unusual trend is first detected. For example, a sudden drop in sales or a rise in product returns.
- Break Down the Data: The data is divided into smaller parts such as region, product category, time period, or customer segment.
- Compare and Analyze: Different datasets are compared to identify differences and relationships. This may include checking correlations, variations, or performance gaps.
- Find the Root Cause: After careful examination, the main reason behind the issue is identified.
Example
Suppose a company notices that monthly sales have decreased. Diagnostic Analytics may examine:
- Sales by region
- Sales by product category
- Pricing changes
- Marketing campaign performance
- Customer feedback
The analysis may reveal that sales declined only in one region due to delivery delays. This identifies the real cause instead of making assumptions.
Importance of Diagnostic Analytics
- Helps in accurate problem solving
- Reduces decision making based on guesswork
- Improves operational efficiency
- Supports better strategic planning
In simple terms, Diagnostic Analytics studies past data in detail to explain the reason behind a specific outcome.
3. Predictive Analytics
Predictive Analytics focuses on answering the question: What is likely to happen next?
After understanding what happened and why it happened, the next logical step is to estimate future outcomes. Predictive Analytics uses past data to make informed forecasts about upcoming events or trends.
Purpose of Predictive Analytics
The main objective is to anticipate future results based on historical patterns. It supports proactive decision-making instead of reactive responses.
How Predictive Analytics Works:
- Collect Historical Data: Data from past activities such as sales records, customer behavior, or operational performance is gathered.
- Prepare and Clean the Data: Errors, missing values, and inconsistencies are removed to ensure accuracy.
- Apply Statistical Models: Mathematical models and algorithms are used to identify patterns and relationships within the data.
- Generate Forecasts: Based on the identified patterns, future outcomes are estimated.
Example
- A retail company may use Predictive Analytics to forecast next month’s sales based on previous years’ data.
- A bank may estimate the probability of loan default by analyzing customer financial history.
- An online platform may predict which products a customer is likely to purchase next.
Importance of Predictive Analytics
- Helps in better planning and budgeting
- Reduces uncertainty in decision-making
- Supports risk management
- Improves resource allocation
In simple words, Predictive Analytics uses past data and statistical techniques to estimate future outcomes and support informed planning.
4. Prescriptive Analytics
Prescriptive Analytics focuses on answering the question: What should be done next?
After identifying what happened, understanding why it happened, and predicting what may happen, the final step is deciding the best course of action. Prescriptive Analytics provides recommendations based on data analysis.
Purpose of Prescriptive Analytics
The main objective is to suggest actions that can improve outcomes or reduce risks. It not only predicts future events but also guides decision-makers toward the most suitable solution.
How Prescriptive Analytics Works:
- Analyze Past and Predicted Data: It uses results from descriptive, diagnostic, and predictive analysis.
- Apply Decision Models: Mathematical models, optimization techniques, and business rules are applied to evaluate possible actions.
- Compare Alternatives: Different strategies are examined to determine which one provides the best result.
- Recommend the Best Action: The system suggests the most effective decision based on data evaluation.
Example
- A delivery company may use Prescriptive Analytics to determine the most efficient delivery route to reduce fuel cost and time.
- An online store may receive recommendations about optimal product pricing to increase profit.
- A hospital may get suggestions on staff scheduling to improve patient care efficiency.
Importance of Prescriptive Analytics
- Supports strategic decision-making
- Improves efficiency and cost control
- Reduces operational risks
- Provides clear action plans
In simple terms, Prescriptive Analytics uses data and decision models to recommend the best possible action for achieving desired results.
Upcoming Masterclass
Attend our live classes led by experienced and desiccated instructors of Wscube Tech.


Tools Used in Data Analytics
Now that the four types of data analytics are clear, the next step is understanding how analytics is performed in real projects. The practical answer lies in using data analytics tools.
Below are some commonly used tools for data analysis.
- Microsoft Excel: Microsoft Excel is commonly used for basic data analysis and reporting. It supports functions, pivot tables, charts, and simple statistical calculations. It is suitable for small to medium-sized datasets and quick analysis tasks.
- SQL (Structured Query Language): SQL is used to manage and retrieve data from relational databases. It helps you filter, sort, join, and summarize large volumes of structured data efficiently. SQL is essential for working with database systems.
- Python: Python is a programming language commonly used for data analysis, automation, and machine learning. Libraries such as Pandas, NumPy, and Matplotlib help in data cleaning, processing, and visualization. It is suitable for both simple and advanced analytics tasks.
- R Programming: R is designed specifically for statistical analysis and data visualization. It is commonly used in research, academic studies, and advanced statistical modeling.
- Tableau: Tableau is a data visualization tool used to create interactive dashboards and reports. It helps you present complex data in a clear and understandable visual format.
- Power BI: Microsoft Power BI is a business analytics tool used for data visualization and reporting. It connects to multiple data sources and helps create dashboards that support business decision-making.
- Apache Hadoop: Apache Hadoop is used for processing and storing very large datasets across distributed systems. It is suitable for big data environments where traditional tools may not handle the data volume effectively.
Selecting the best tool depends on your data size, technical skills, and analysis objectives. In many cases, organizations use a combination of tools to achieve accurate and meaningful results.
Also Read: Data Analyst Job Description: Responsibilities and Skills
Advantages and Disadvantages of Each Type of Data Analytics
Each type of data analytics serves a specific purpose in decision-making. Understanding their advantages and limitations helps you apply the right approach in the right situation.
Below are the advantages and disadvantages of each type of data analytics:
| Type of Data Analytics | Advantages | Disadvantages |
| Descriptive Analytics | - Provides a clear summary of past events. - Easy to understand and implement. - Helps track performance using reports and dashboards. |
- Focuses only on historical data. - Does not explain causes behind outcomes. - Cannot predict future results. |
| Diagnostic Analytics | - Identifies root causes of problems. - Helps understand relationships between variables. - Supports better problem-solving decisions. |
- Requires detailed and accurate data. - Analysis can be time-consuming. - May not provide future guidance. |
| Predictive Analytics | - Uses historical data to forecast future outcomes. - Helps in risk assessment and planning. - Supports proactive decision-making. |
- Predictions depend on data quality. - Models may produce errors if assumptions are incorrect. - Requires technical expertise. |
| Prescriptive Analytics | - Suggests recommended actions based on data. - Helps optimize decisions and resource allocation. - Supports strategic planning. |
- Complex to design and implement. - Requires advanced tools and computing power. - May rely heavily on assumptions and model accuracy. |
Notes:
- Selecting the appropriate type depends on your business objective, available data, and technical capability.
- In practice, organizations commonly combine multiple types to gain deeper and more actionable insights.
Read More Data Related Guides
| Top Data Analyst Career Paths | Data Analyst Roadmap |
| Is Data Analyst A Good Career? | 20+ Data Analytics Projects |
| Top Data Analytics Tools | What Does a Data Analyst Do? |
Real-World Applications of Each Type of Data Analytics (2026)
After understanding the types of data analytics, the next step is to examine their real-world use. In 2026, organizations across industries combine these data analytics types to address practical business challenges.
The following are the applications of each type:
Descriptive Analytics
- Sales reports showing monthly revenue and profit.
- Website dashboards displaying daily visitors and traffic sources.
- Financial statements summarizing annual performance.
- Hospital records tracking patient admission rates.
Diagnostic Analytics
- Identifying reasons behind a sudden drop in sales.
- Analyzing production delays in manufacturing.
- Studying customer complaints to find service gaps.
- Investigating system failures in IT operations.
Predictive Analytics
- Forecasting future product demand.
- Predicting customer churn in telecom or banking.
- Estimating credit risk in financial institutions.
- Anticipating equipment failure using maintenance data.
Prescriptive Analytics
- Recommending optimal pricing strategies.
- Suggesting inventory levels to avoid stock shortages.
- Planning delivery routes to reduce fuel costs.
- Providing treatment recommendations in healthcare based on patient data.
Also Read: Top 8 In-Demand Data Analyst Skills
Challenges in Data Analytics
Data analytics provides valuable insights, but implementing it effectively is not simple. Organizations face several technical, operational, and strategic challenges while managing and analyzing data.
Below are some common challenges in data analytics:
- Data Quality Issues: Accurate analysis depends on accurate data. Incomplete, duplicate, or inconsistent data can lead to incorrect conclusions and poor decisions.
- Data Integration Problems: Organizations commonly collect data from multiple systems and platforms. Combining this data into a unified format can be complex and time-consuming.
- Data Security and Privacy Concerns: Handling large volumes of data increases the risk of security breaches. Protecting sensitive information and complying with data protection regulations is a major responsibility.
- Lack of Skilled Professionals: Effective data analytics requires knowledge of tools, statistics, and domain understanding. Many organizations face a shortage of trained professionals who can interpret data correctly.
- High Implementation Costs: Advanced analytics tools, infrastructure, and maintenance require financial investment. Small and medium-sized organizations may find these costs challenging.
- Managing Large Data Volumes: As data grows rapidly, storing and processing it becomes more difficult. Traditional systems may not handle large datasets efficiently without upgrades.
- Interpreting Results Correctly: Even with proper analysis, misinterpreting results can lead to wrong actions. Clear understanding and context are necessary to convert insights into effective strategies.
Addressing these challenges requires proper planning, skilled resources, secure systems, and a structured data management approach.
Join Our On-Campus Data Analytics Program
How to Use AI for Data Analytics in 2026
In 2026, AI plays a key role in data analytics by helping organizations process data faster and make smarter decisions. It turns raw data into useful insights and supports real-time action.
Here are the key ways AI is transforming data analytics:
Automate Data Collection and Cleaning
AI tools can automatically gather data from multiple sources such as databases, applications, and cloud platforms. They can also identify missing values, remove duplicates, and correct inconsistencies. This reduces manual effort and improves data quality before analysis begins.
Apply Machine Learning Models
Machine learning algorithms can analyze historical data to identify patterns and trends. In 2026, many analytics platforms include built-in predictive models that help forecast sales, customer behavior, and operational risks without requiring advanced coding skills.
Use Natural Language Processing (NLP)
Natural Language Processing allows AI systems to analyze text-based data such as emails, reviews, and social media comments. This helps you understand customer sentiment, detect common issues, and improve service quality.
Generate Automated Insights
Modern AI-driven analytics tools can automatically generate summaries, highlight unusual patterns, and suggest key findings. Instead of manually searching for trends, you can review AI-generated reports that explain what the data indicates.
Build Interactive Dashboards with AI Support
AI-powered dashboards can update in real time and provide recommendations based on current data. These dashboards help managers monitor performance and respond quickly to changes.
Improve Decision-Making with Prescriptive Analytics
AI systems can simulate different scenarios and recommend the best possible action. For example, they can suggest optimal pricing, inventory levels, or marketing strategies based on current market conditions.
Ensure Ethical and Secure AI Usage
In 2026, responsible AI usage is essential. Organizations must ensure data privacy, prevent bias in models, and maintain transparency in automated decisions. Clear governance policies help build trust in AI-driven analytics.
By integrating AI into data analytics processes, you can reduce manual workload, improve accuracy, and move from reactive reporting to proactive decision-making.

FAQs About Data Analytics Types
The main types of data analytics are descriptive, diagnostic, predictive, and prescriptive. These data analytics types help organizations review past performance, identify causes, forecast outcomes, and recommend suitable actions based on available data.
Data analytics is the process of collecting, organizing, and analyzing raw data to find useful information. It helps turn numbers and facts into meaningful insights that support better decision-making and business planning.
Data analytics is important because it helps organizations understand performance, identify problems, and plan future actions. By using data instead of assumptions, decisions become more accurate and structured.
The types of data analytics function as a connected system. Descriptive explains what happened, diagnostic clarifies why, predictive estimates future possibilities, and prescriptive recommends actions, creating a structured decision-making approach.
Data analysis usually focuses on examining data to answer specific questions. Data analytics is broader and includes collecting, managing, analyzing, and interpreting data to support overall strategy and decision-making.
Types of data analytics techniques include data mining, statistical analysis, machine learning, data visualization, and regression analysis. These techniques support different types of data analytics by helping extract patterns, trends, and useful insights from raw data.
The 4 parts of data analysis generally include data collection, data cleaning, data analysis, and data interpretation. These steps ensure that information is accurate, properly examined, and clearly explained for decision-making purposes.
The top 3 skills for a data analyst are analytical thinking, technical knowledge, and communication skills. A data analyst must understand data analytics types, work with tools like SQL or Python, and clearly explain findings to others.
Explore Our Free Tech Tutorials


Leave a comment
Your email address will not be published. Required fields are marked *Comments (0)
No comments yet.