Ever learned data analytics but still feel stuck when it comes to building real projects? You’re not alone.
Many beginners struggle to find the right data analytics project ideas. They either choose something too simple that doesn’t impress recruiters or pick something too complex that becomes confusing and hard to finish.
This leads to wasted time, low confidence, and missed job opportunities—especially when your portfolio doesn’t stand out.
But here’s the good part—the right project idea can make everything easier. It helps you learn faster, build confidence, and showcase your skills in a practical way.
In this blog, you’ll discover the best data analytics project ideas and how to choose the right one.
You can join our data analytics online course and build job-ready skills with step-by-step learning and practical experience.
Why Data Analytics Projects Are Important for Learning
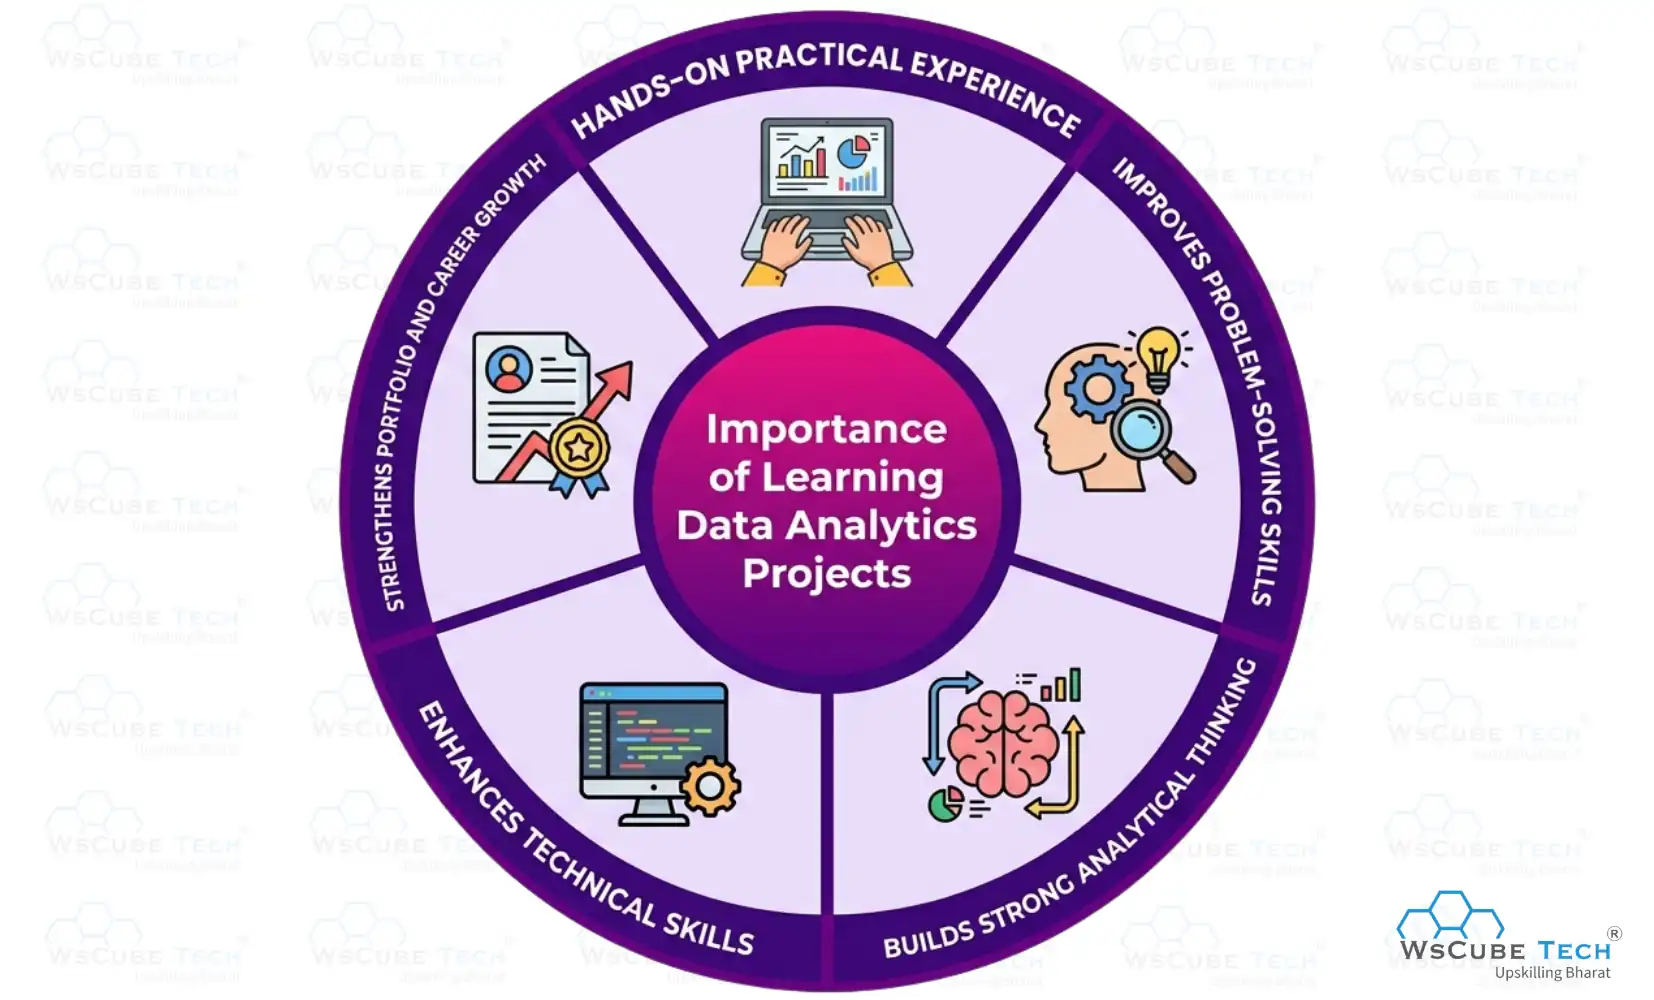
Data analytics projects help learners build practical skills, gain hands-on experience, and understand how real-world data is used to make smarter decisions. Below are the key reasons why they are important for learning:
- Hands-On Practical Experience: Working on projects helps learners apply theoretical concepts to real datasets, dashboards, and reports, making it easier to understand data cleaning, visualization, and analysis in practical business scenarios.
- Improves Problem-Solving Skills: Projects challenge learners to identify patterns, solve data-related problems, and make data-driven decisions, which strengthens logical thinking and improves their ability to handle real industry use cases.
- Builds Strong Analytical Thinking: By working with trends and comparisons, learners develop the ability to analyze data effectively, identify patterns, gain meaningful insights, and draw clear conclusions for better decision-making and problem-solving.
- Enhances Technical Skills: Projects improve knowledge of tools such as Excel, SQL, Python, Power BI, and Tableau, helping learners gain confidence in using industry-relevant technologies for analytics tasks.
- Strengthens Portfolio and Career Growth: Completing projects helps build a strong portfolio that showcases practical knowledge and skills, making it easier for students and professionals to stand out in the job market.
Also Read: How to Become a Data Analyst
Beginner-Level Data Analytics Project Ideas
Below are the best data analytics projects for beginners that build practical skills, improve analytical thinking, and provide hands-on experience with real datasets:
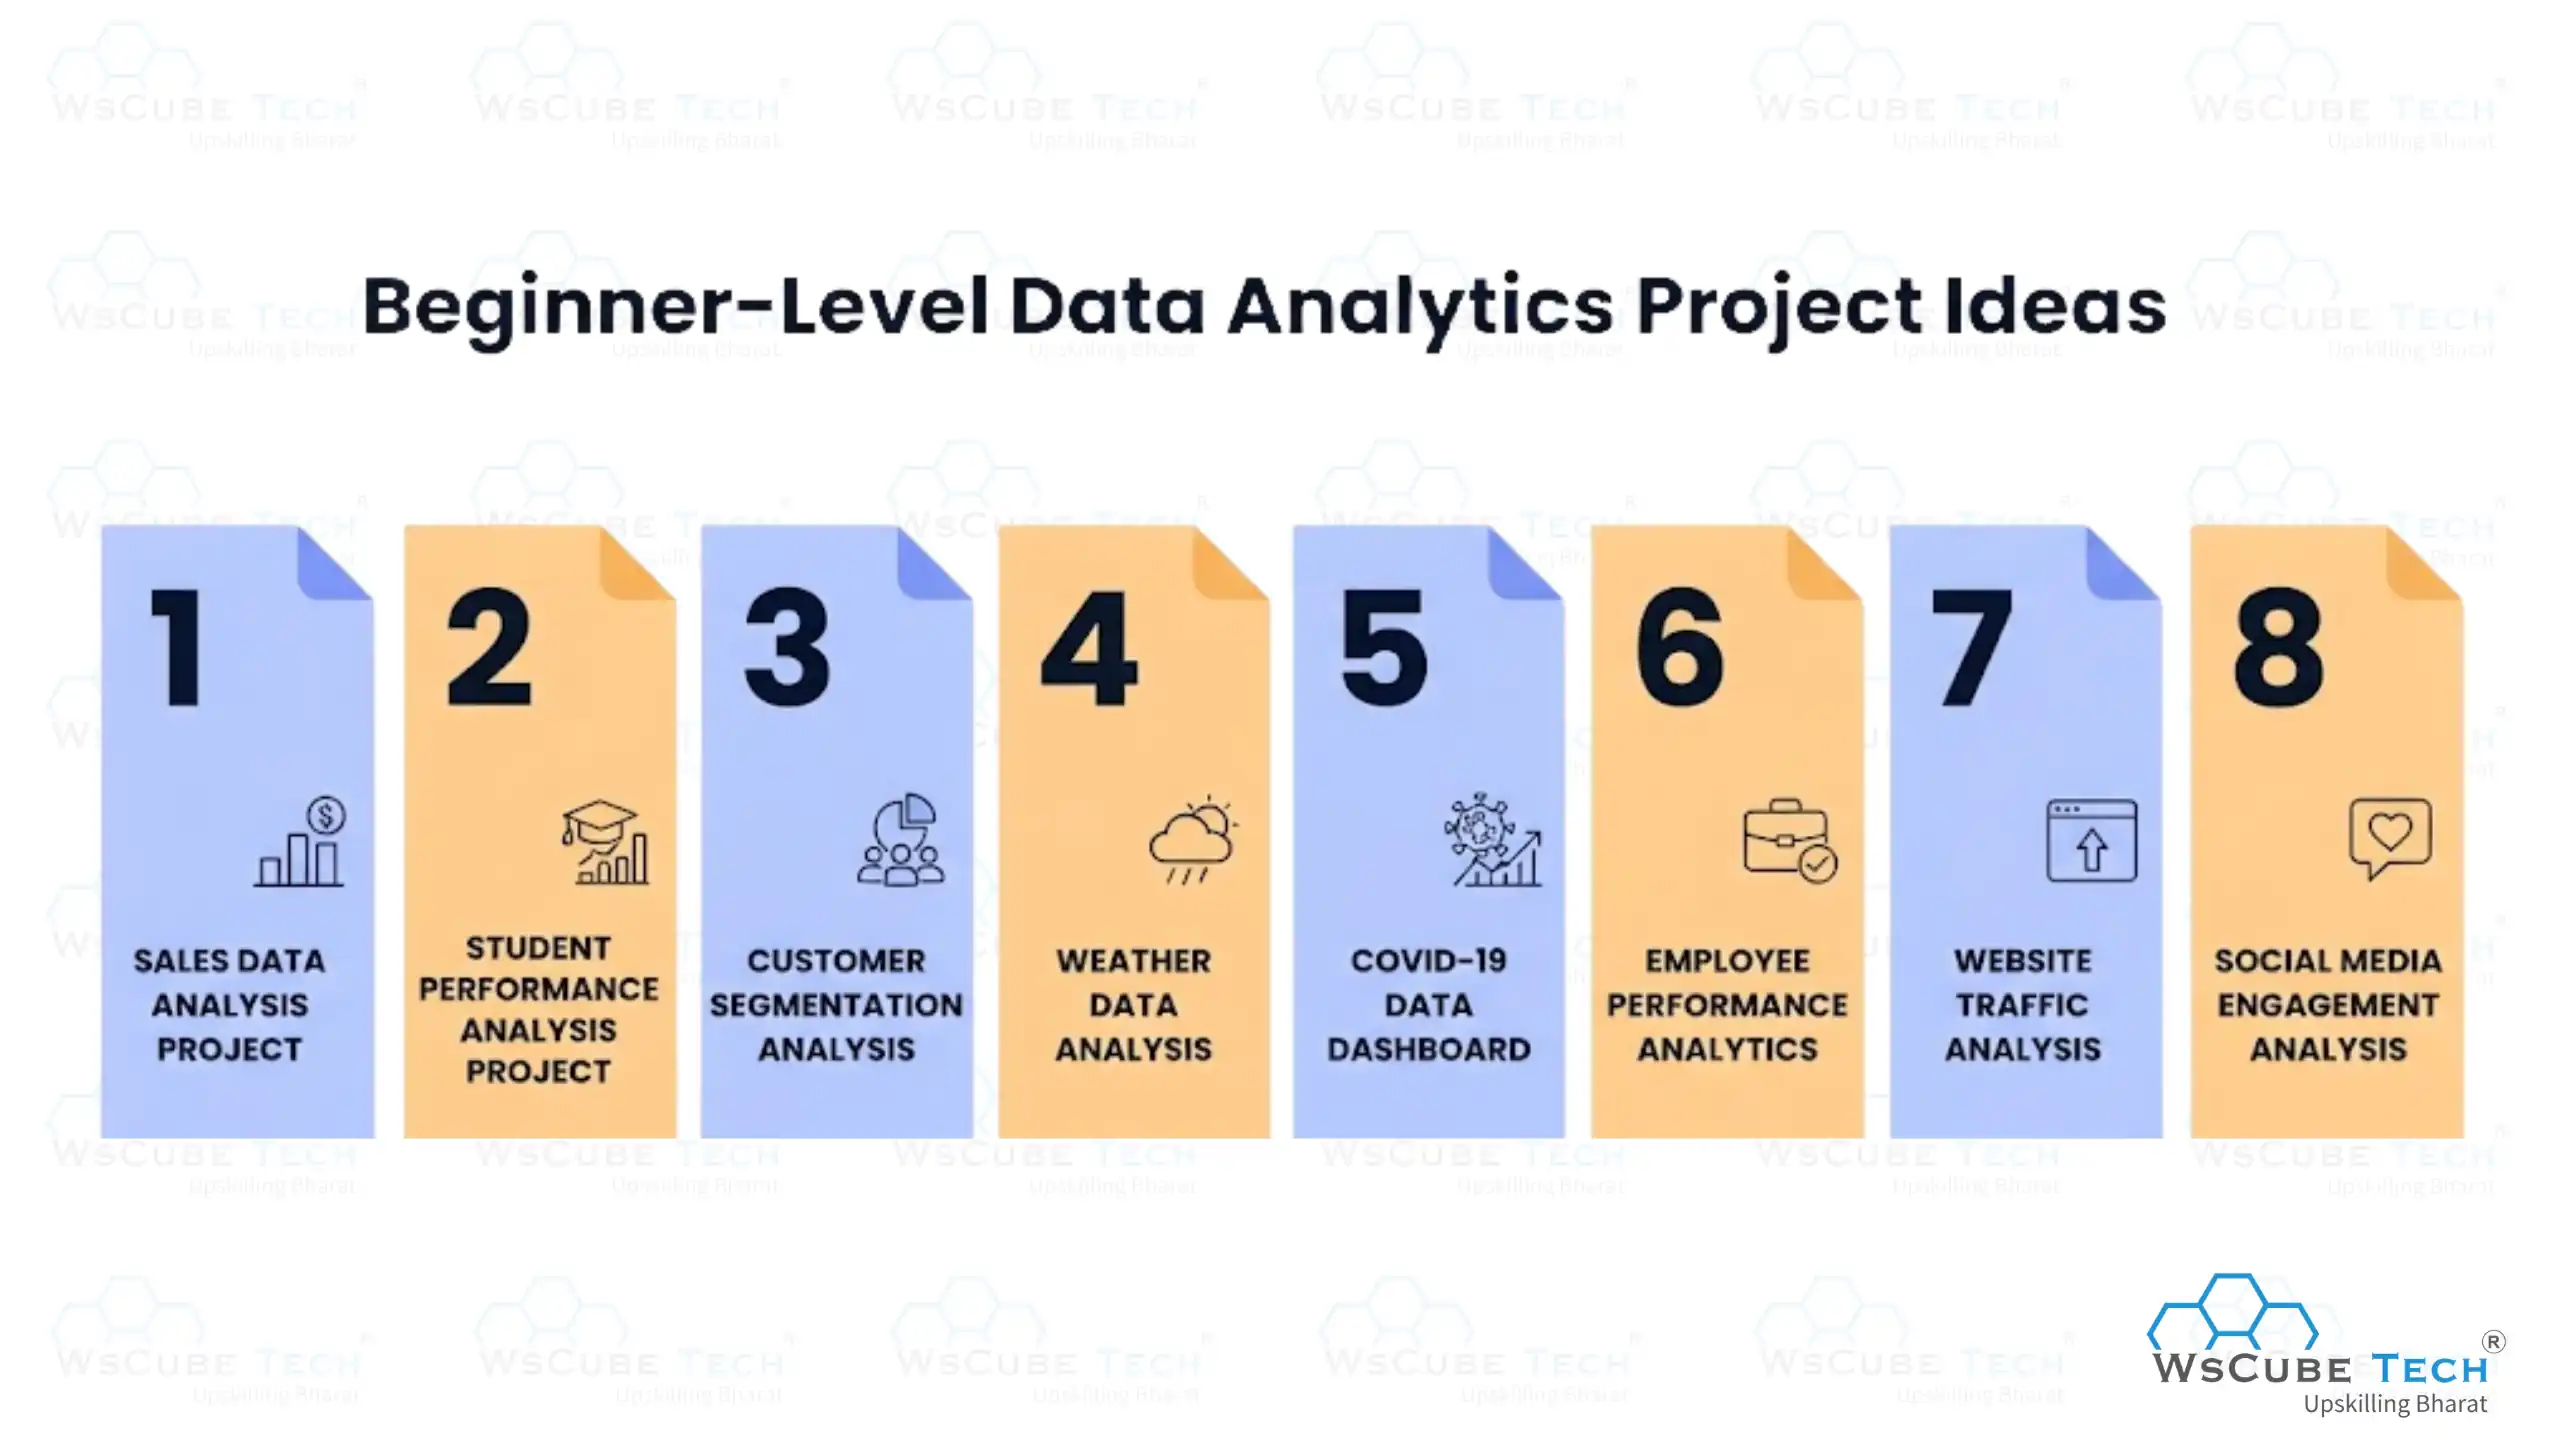
1. Sales Data Analysis Project
The Sales Data Analysis Project is one of the best beginner-friendly analytics projects. In this project, we analyze sales data to identify revenue trends, top-selling products, customer buying behavior, and region-wise performance. It is a great project for understanding how businesses use data to improve sales strategies and make informed decisions.
How It Works
- Collect the sales dataset from a reliable source.
- Clean the data by removing missing or incorrect values.
- Analyze monthly sales trends and revenue growth.
- Identify top-selling products and region-wise performance.
- Create charts and dashboards to visualize insights.
Skills You Practice
- Data preprocessing
- Data cleaning
- Trend analysis
- Data visualization
- Dashboard creation
- Business reporting
Tools Used: Excel, SQL, Python, Power BI / Tableau
Source Code: Sales Data Analysis Project
2. Student Performance Analysis Project
The Student Performance Analysis Project is a beginner-friendly data analytics project where you analyze student data to understand academic performance, study patterns, and factors affecting results. It helps you learn how data can improve educational outcomes and decision-making.
How It Works
- Collect the student dataset from a reliable source.
- Clean and preprocess the data if needed.
- Analyze marks, attendance, subjects, and grades.
- Compare subject-wise and overall performance trends.
- Create charts and reports to visualize student progress.
- Generate final insights to understand performance patterns.
Skills You Practice
- Data preprocessing
- Data cleaning
- Performance analysis
- Data visualization
- Report creation
- Trend analysis
Tools Used: Excel, Python, SQL, Power BI, Tableau, Jupyter Notebook
Source Code: Student Performance Analysis
3. Customer Segmentation Analysis
The Customer Segmentation Analysis Project is a popular data analytics project where you group customers based on behavior, demographics, or purchasing patterns. It helps businesses understand different customer types and create targeted marketing strategies.
How It Works
- Collect the customer dataset from a reliable source.
- Prepare the data for analysis if needed.
- Analyze key features such as age, income, spending score, and purchase history.
- Group customers into different segments based on common patterns.
- Create charts and dashboards to visualize customer groups.
- Generate final insights to support marketing and business decisions.
Skills You Practice
- Data preprocessing and cleaning
- Exploratory Data Analysis (EDA)
- Customer behavior analysis
- Data visualization
- Dashboard creation
Tools Used: Excel, Python, Scikit-learn, SQL, Power BI, Tableau, Jupyter Notebook
Source Code: Customer Segmentation Analysis
4. Weather Data Analysis
The Weather Data Analysis Project helps you analyze weather data to understand temperature changes, rainfall patterns, humidity levels, wind speed, and seasonal trends. It is useful for learning how environmental data is studied to identify patterns, compare climate changes, and support basic weather forecasting.
How It Works
- Collect the weather dataset from a reliable source.
- Clean and preprocess the data if needed.
- Analyze temperature, humidity, rainfall, wind speed, and date-based trends.
- Study daily, monthly, and seasonal weather patterns.
- Create charts and dashboards to visualize weather insights.
- Generate final reports to understand climate changes and forecasting trends.
Skills You Practice
- Data cleaning and preprocessing
- Exploratory data analysis (EDA)
- Time-series analysis
- Trend and pattern analysis
- Data visualization
- Dashboard creation
Tools Used: Excel, Python, SQL, Power BI, Tableau, Jupyter Notebook
Source Code: Weather Data Analysis
Recommended Professional Certificates
Data Analytics Course with Gen AI
Data Science Course with Internship & Placement Support
5. COVID-19 Data Dashboard
The COVID-19 Data Dashboard project is a beginner-friendlydata analytics project that helps analyze pandemic-related data such as confirmed cases, recoveries, deaths, testing rates, and vaccination trends. It is a great project for learning how real-world public health data is visualized to track patterns, compare regions, and support data-driven decision-making.
How It Works
- Collect the COVID-19 dataset from a reliable source.
- Clean and preprocess the data if needed.
- Analyze date-wise confirmed cases, recoveries, deaths, and regional trends.
- Study daily and monthly case growth patterns.
- Create interactive charts and dashboards to compare regions and time periods.
- Generate final insights to understand spread patterns and recovery trends.
Skills You Practice
- Data preprocessing and cleaning
- Exploratory Data Analysis (EDA)
- Time-series analysis
- Trend and pattern analysis
- Data visualization
- Dashboard creation
Tools Used: Excel, Python, SQL, Power BI, Tableau, Jupyter Notebook
Source Code: COVID-19 Data Dashboard
6. Employee Performance Analytics
The Employee Performance Analytics project helps analyze employee data to evaluate productivity, attendance, task completion, and overall performance trends. It is a great project for learning how organizations use data to improve workforce management, measure efficiency, and support better decision-making.
How It Works
- Collect the employee dataset from a reliable source.
- Clean and preprocess the data if needed.
- Analyze employee ID, department, attendance, ratings, and work-hour data.
- Study individual and department-wise performance trends.
- Create charts and dashboards to compare productivity and performance metrics.
- Generate final insights to support HR and management decisions.
Skills You Practice
- Data preprocessing and cleaning
- Exploratory Data Analysis (EDA)
- Performance analysis
- Trend and pattern analysis
- Data visualization
- Dashboard creation
Tools Used: Excel, Python, SQL, Power BI, Tableau, Jupyter Notebook
Source Code: Employee Performance Analytics
7. Website Traffic Analysis
The Website Traffic Analysis project focuses on analyzing website data to understand user behavior, traffic sources, page performance, and engagement metrics. It helps you learn how businesses track online performance and optimize websites for a better user experience and growth.
How It Works
- Collect the website traffic dataset from a reliable source.
- Clean and preprocess the data if required.
- Analyze page views, visitors, traffic sources, session duration, and bounce rate.
- Study daily, weekly, and monthly traffic trends.
- Create charts and dashboards to visualize user activity and traffic sources.
- Generate reports with actionable insights.
Skills You Practice
- Data preprocessing and cleaning
- Exploratory Data Analysis (EDA)
- Web traffic analysis
- Trend and pattern analysis
- Data visualization
- Dashboard creation
Tools Used: Excel, Python, SQL, Google Analytics, Power BI, Tableau, Jupyter Notebook
Source Code: Website Traffic Analysis
8. Social Media Engagement Analysis
The Social Media Engagement Analysis project focuses on analyzing social media data to understand audience behavior, likes, shares, comments, reach, and engagement trends. It helps you learn how brands and businesses measure content performance and improve their social media strategies for better audience growth.
How It Works
- Collect the social media dataset from a reliable source.
- Clean and preprocess the data if required.
- Analyze likes, comments, shares, impressions, reach, and post types.
- Study daily, weekly, and monthly engagement trends.
- Create charts and dashboards to visualize audience interaction and content performance.
- Generate reports with actionable insights for strategy improvement.
Skills You Practice
- Data cleaning and preprocessing
- Social media analytics
- Trend and pattern analysis
- Data visualization
- Dashboard creation
Tools Used: Excel, Python, SQL, Power BI, Tableau, Jupyter Notebook
Source Code: Social Media Engagement Analysis
Upcoming Masterclass
Attend our live classes led by experienced and desiccated instructors of Wscube Tech.

Intermediate-Level Data Analytics Project Ideas
After completing basic projects, you can move to intermediate data analytics projects with source code to improve practical skills and real-world problem-solving:
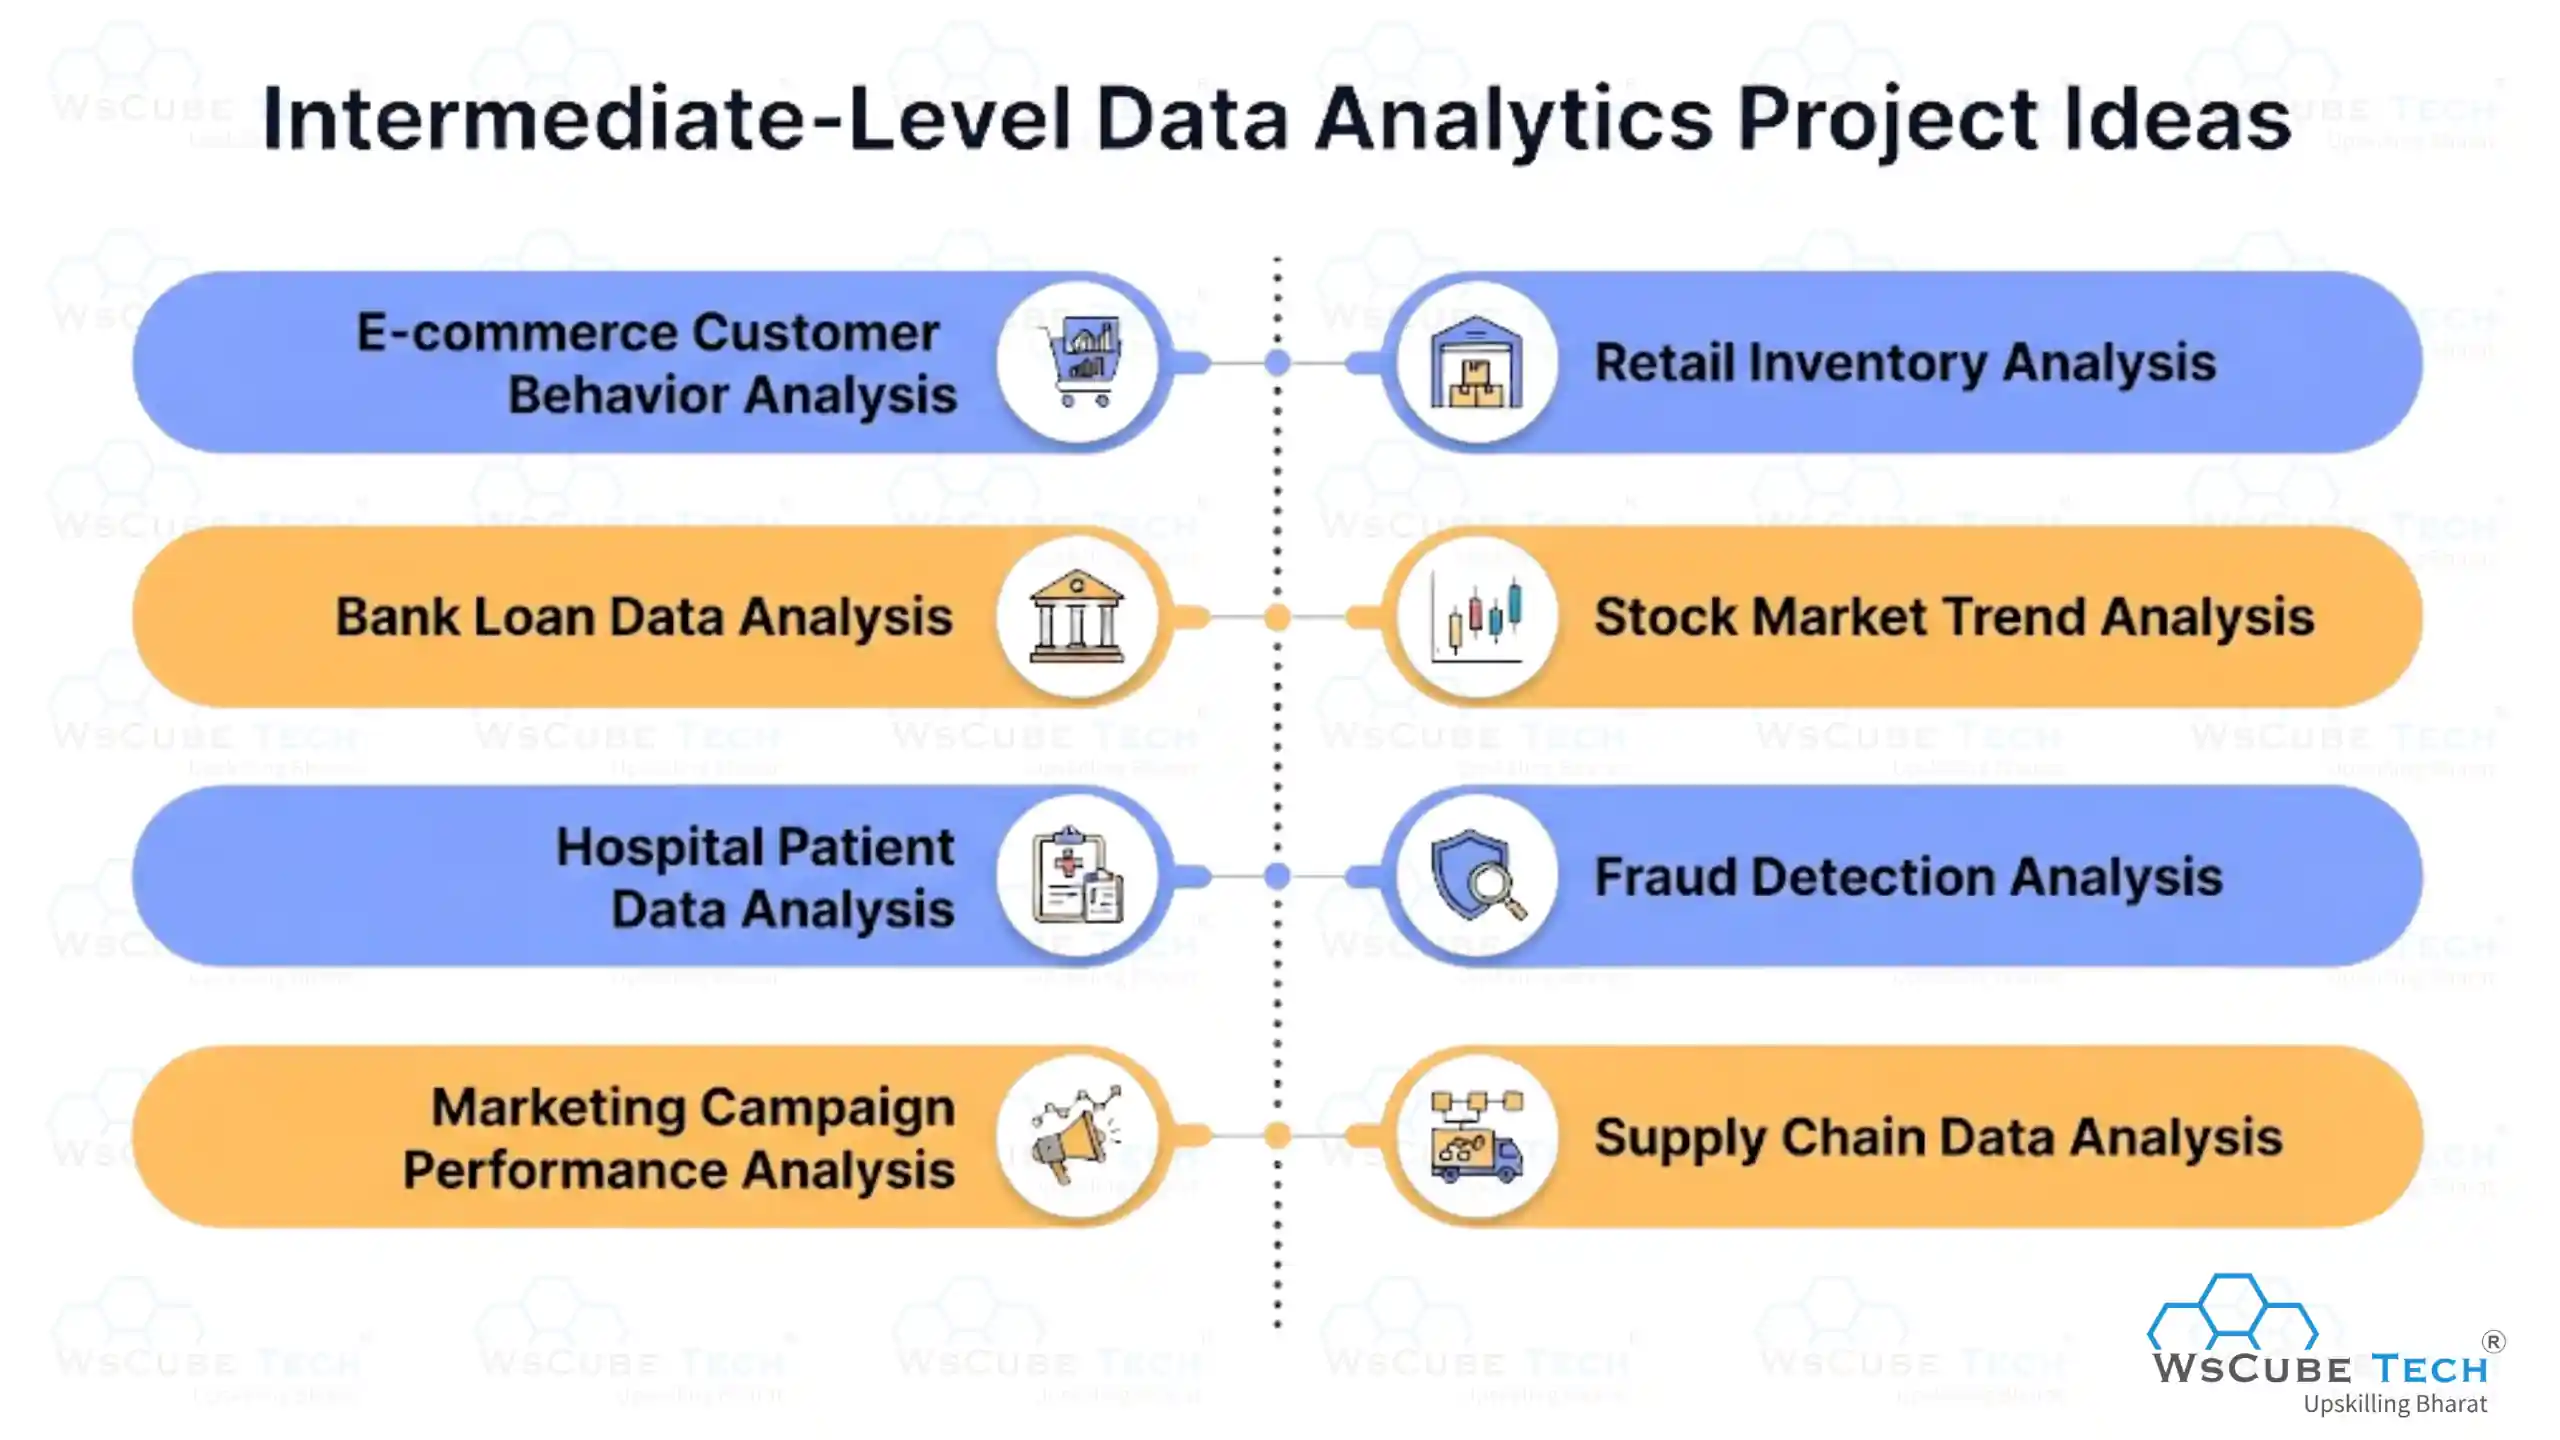
1. E-commerce Customer Behavior Analysis
The E-commerce Customer Behavior Analysis project focuses on analyzing customer data to understand browsing patterns, purchase history, cart abandonment, product preferences, and buying trends. It helps you learn how online businesses use customer insights to improve sales strategies, personalize recommendations, and enhance the shopping experience.
How It Works
- Collect the e-commerce customer dataset from a reliable source.
- Clean and preprocess the data if required.
- Analyze customer IDs, product categories, purchase amounts, cart activity, and visit frequency.
- Study browsing and purchasing trends.
- Create charts and dashboards to visualize customer behavior and sales patterns.
- Generate reports with actionable business insights.
Skills You Practice
- Data preprocessing and cleaning
- Exploratory Data Analysis (EDA)
- Customer behavior analysis
- Trend and pattern analysis
- Data visualization
- Dashboard creation
Tools Used: Excel, Python, SQL, Power BI, Tableau, Jupyter Notebook
Source Code: E-commerce Customer Behavior Analysis
2. Retail Inventory Analysis
The Retail Inventory Analysis project focuses on analyzing inventory data to track stock levels, product demand, sales movement, reorder points, and warehouse performance. It helps you learn how retail businesses use data to manage inventory efficiently, reduce stock shortages, and optimize supply chain decisions.
How It Works
- Collect the retail inventory dataset from a reliable source.
- Clean and preprocess the data if required.
- Analyze product IDs, stock quantity, sales units, reorder levels, and warehouse locations.
- Study stock movement and demand trends.
- Create charts and dashboards to visualize inventory performance and stock levels.
- Generate reports with actionable inventory insights.
Skills You Practice
- Data preprocessing and cleaning
- Exploratory Data Analysis (EDA)
- Inventory analysis
- Trend and demand analysis
- Data visualization
- Dashboard creation
Tools Used: Excel, Python, SQL, Power BI, Tableau, Jupyter Notebook
Source Code: Retail Inventory Analysis
3. Bank Loan Data Analysis
The Bank Loan Data Analysis project focuses on analyzing loan data to understand approval rates, borrower profiles, loan amounts, repayment patterns, and risk factors. It helps you learn how financial institutions use data to assess creditworthiness, reduce default risk, and make informed lending decisions.
How It Works
- Collect the bank loan dataset from a reliable source.
- Clean and preprocess the data if required.
- Analyze applicant income, loan amount, credit history, employment status, and loan status.
- Study loan approval trends and borrower patterns.
- Create charts and dashboards to visualize approval rates and risk insights.
- Generate reports to support better lending decisions.
Skills You Practice
- Data preprocessing and cleaning
- Exploratory Data Analysis (EDA)
- Financial data analysis
- Risk and pattern analysis
- Data visualization
- Dashboard creation
Tools Used: Excel, Python, SQL, Power BI, Tableau, Jupyter Notebook
Source Code: Bank Loan Data Analysis
4. Stock Market Trend Analysis
The Stock Market Trend Analysis project focuses on analyzing stock price data to understand market movements, price fluctuations, trading volume, and trend patterns over time. It helps you learn how financial data is used to identify trends, compare stock performance, and support investment decision-making.
How It Works
- Collect the stock market dataset from a reliable source.
- Clean and preprocess the data if required.
- Analyze stock price, volume, date, high, low, and closing price data.
- Study daily, weekly, and monthly price trends.
- Create charts and dashboards to visualize market movements and trading patterns.
- Generate reports with trend insights and performance comparisons.
Skills You Practice
- Data preprocessing and cleaning
- Exploratory Data Analysis (EDA)
- Time-series analysis
- Trend and pattern analysis
- Data visualization
- Dashboard creation
Tools Used: Excel, Python, SQL, Power BI, Tableau, Jupyter Notebook, Yahoo Finance API
Source Code: Stock Market Trend Analysis
Also Read: Top Programming Languages for Data Analytics
5. Hospital Patient Data Analysis
The Hospital Patient Data Analysis project focuses on analyzing healthcare data to understand patient records, treatment outcomes, admission trends, and resource utilization. It helps you learn how data is used to improve patient care, optimize hospital operations, and support medical decision-making.
How It Works
- Collect the hospital patient dataset from a reliable source.
- Clean and preprocess the data if required.
- Analyze patient ID, age, diagnosis, admission date, treatment status, and discharge date.
- Study patient trends, disease frequency, and treatment outcomes.
- Create charts and dashboards to visualize patient statistics and hospital performance.
- Generate reports with healthcare insights and operational findings.
Skills You Practice
- Data preprocessing and cleaning
- Exploratory Data Analysis (EDA)
- Healthcare data analysis
- Trend and pattern analysis
- Data visualization
- Dashboard creation
Tools Used: Excel, Python, SQL, Power BI, Tableau, Jupyter Notebook
Source Code: Hospital Patient Data Analysis
6. Fraud Detection Analysis
The Fraud Detection Analysis project focuses on analyzing transaction data to identify suspicious activities, unusual patterns, and potential fraudulent behavior. It helps you learn how businesses and financial institutions use data to reduce fraud risk, monitor transactions, and support secure decision-making.
How It Works
- Collect the transaction dataset from a reliable source.
- Clean and preprocess the data if required.
- Analyze transaction ID, amount, time, location, payment method, and fraud status.
- Study normal and suspicious transaction patterns.
- Create charts and dashboards to visualize fraud trends and risk indicators.
- Generate reports with fraud insights and detection findings.
Skills You Practice
- Data preprocessing and cleaning
- Fraud pattern analysis
- Anomaly detection
- Data visualization
- Dashboard creation
Tools Used: Excel, Python, SQL, Power BI, Tableau, Jupyter Notebook, Scikit-learn
Source Code: Fraud Detection Analysis
7. Marketing Campaign Performance Analysis
The Marketing Campaign Performance Analysis project focuses on analyzing campaign data to measure reach, clicks, conversions, engagement, and return on investment (ROI). It helps you learn how businesses evaluate marketing strategies, understand audience response, and optimize future campaigns for better performance.
How It Works
- Collect the marketing campaign dataset from a reliable source.
- Clean and preprocess the data if required.
- Analyze campaign ID, impressions, clicks, conversions, cost, and ROI.
- Study campaign performance trends and audience engagement patterns.
- Create charts and dashboards to visualize campaign results and KPIs.
- Generate reports with actionable insights for strategy improvement.
Skills You Practice
- Data preprocessing and cleaning
- Exploratory Data Analysis (EDA)
- Marketing performance analysis
- KPI and ROI analysis
- Data visualization
- Dashboard creation
Tools Used: Excel, Python, SQL, Google Analytics, Power BI, Tableau, Jupyter Notebook
Source Code: Marketing Campaign Performance Analysis
8. Supply Chain Data Analysis
The Supply Chain Data Analysis project focuses on analyzing logistics and operational data to track inventory flow, supplier performance, delivery timelines, transportation costs, and demand trends. It helps you learn how businesses optimize supply chain operations, reduce delays, and improve overall efficiency.
How It Works
- Collect the supply chain dataset from a reliable source.
- Clean and preprocess the data if required.
- Analyze supplier ID, inventory levels, shipment dates, delivery status, transportation cost, and demand quantity.
- Study delivery performance and demand trends.
- Create charts and dashboards to visualize logistics performance and inventory movement.
- Generate reports to support better supply chain decision-making.
Skills You Practice
- Data preprocessing and cleaning
- Exploratory Data Analysis (EDA)
- Supply chain analysis
- Demand and trend analysis
- Data visualization
- Dashboard creation
Tools Used: Excel, Python, SQL, Power BI, Tableau, Jupyter Notebook
Source Code: Supply Chain Data Analysis
Read More Data Related Guides
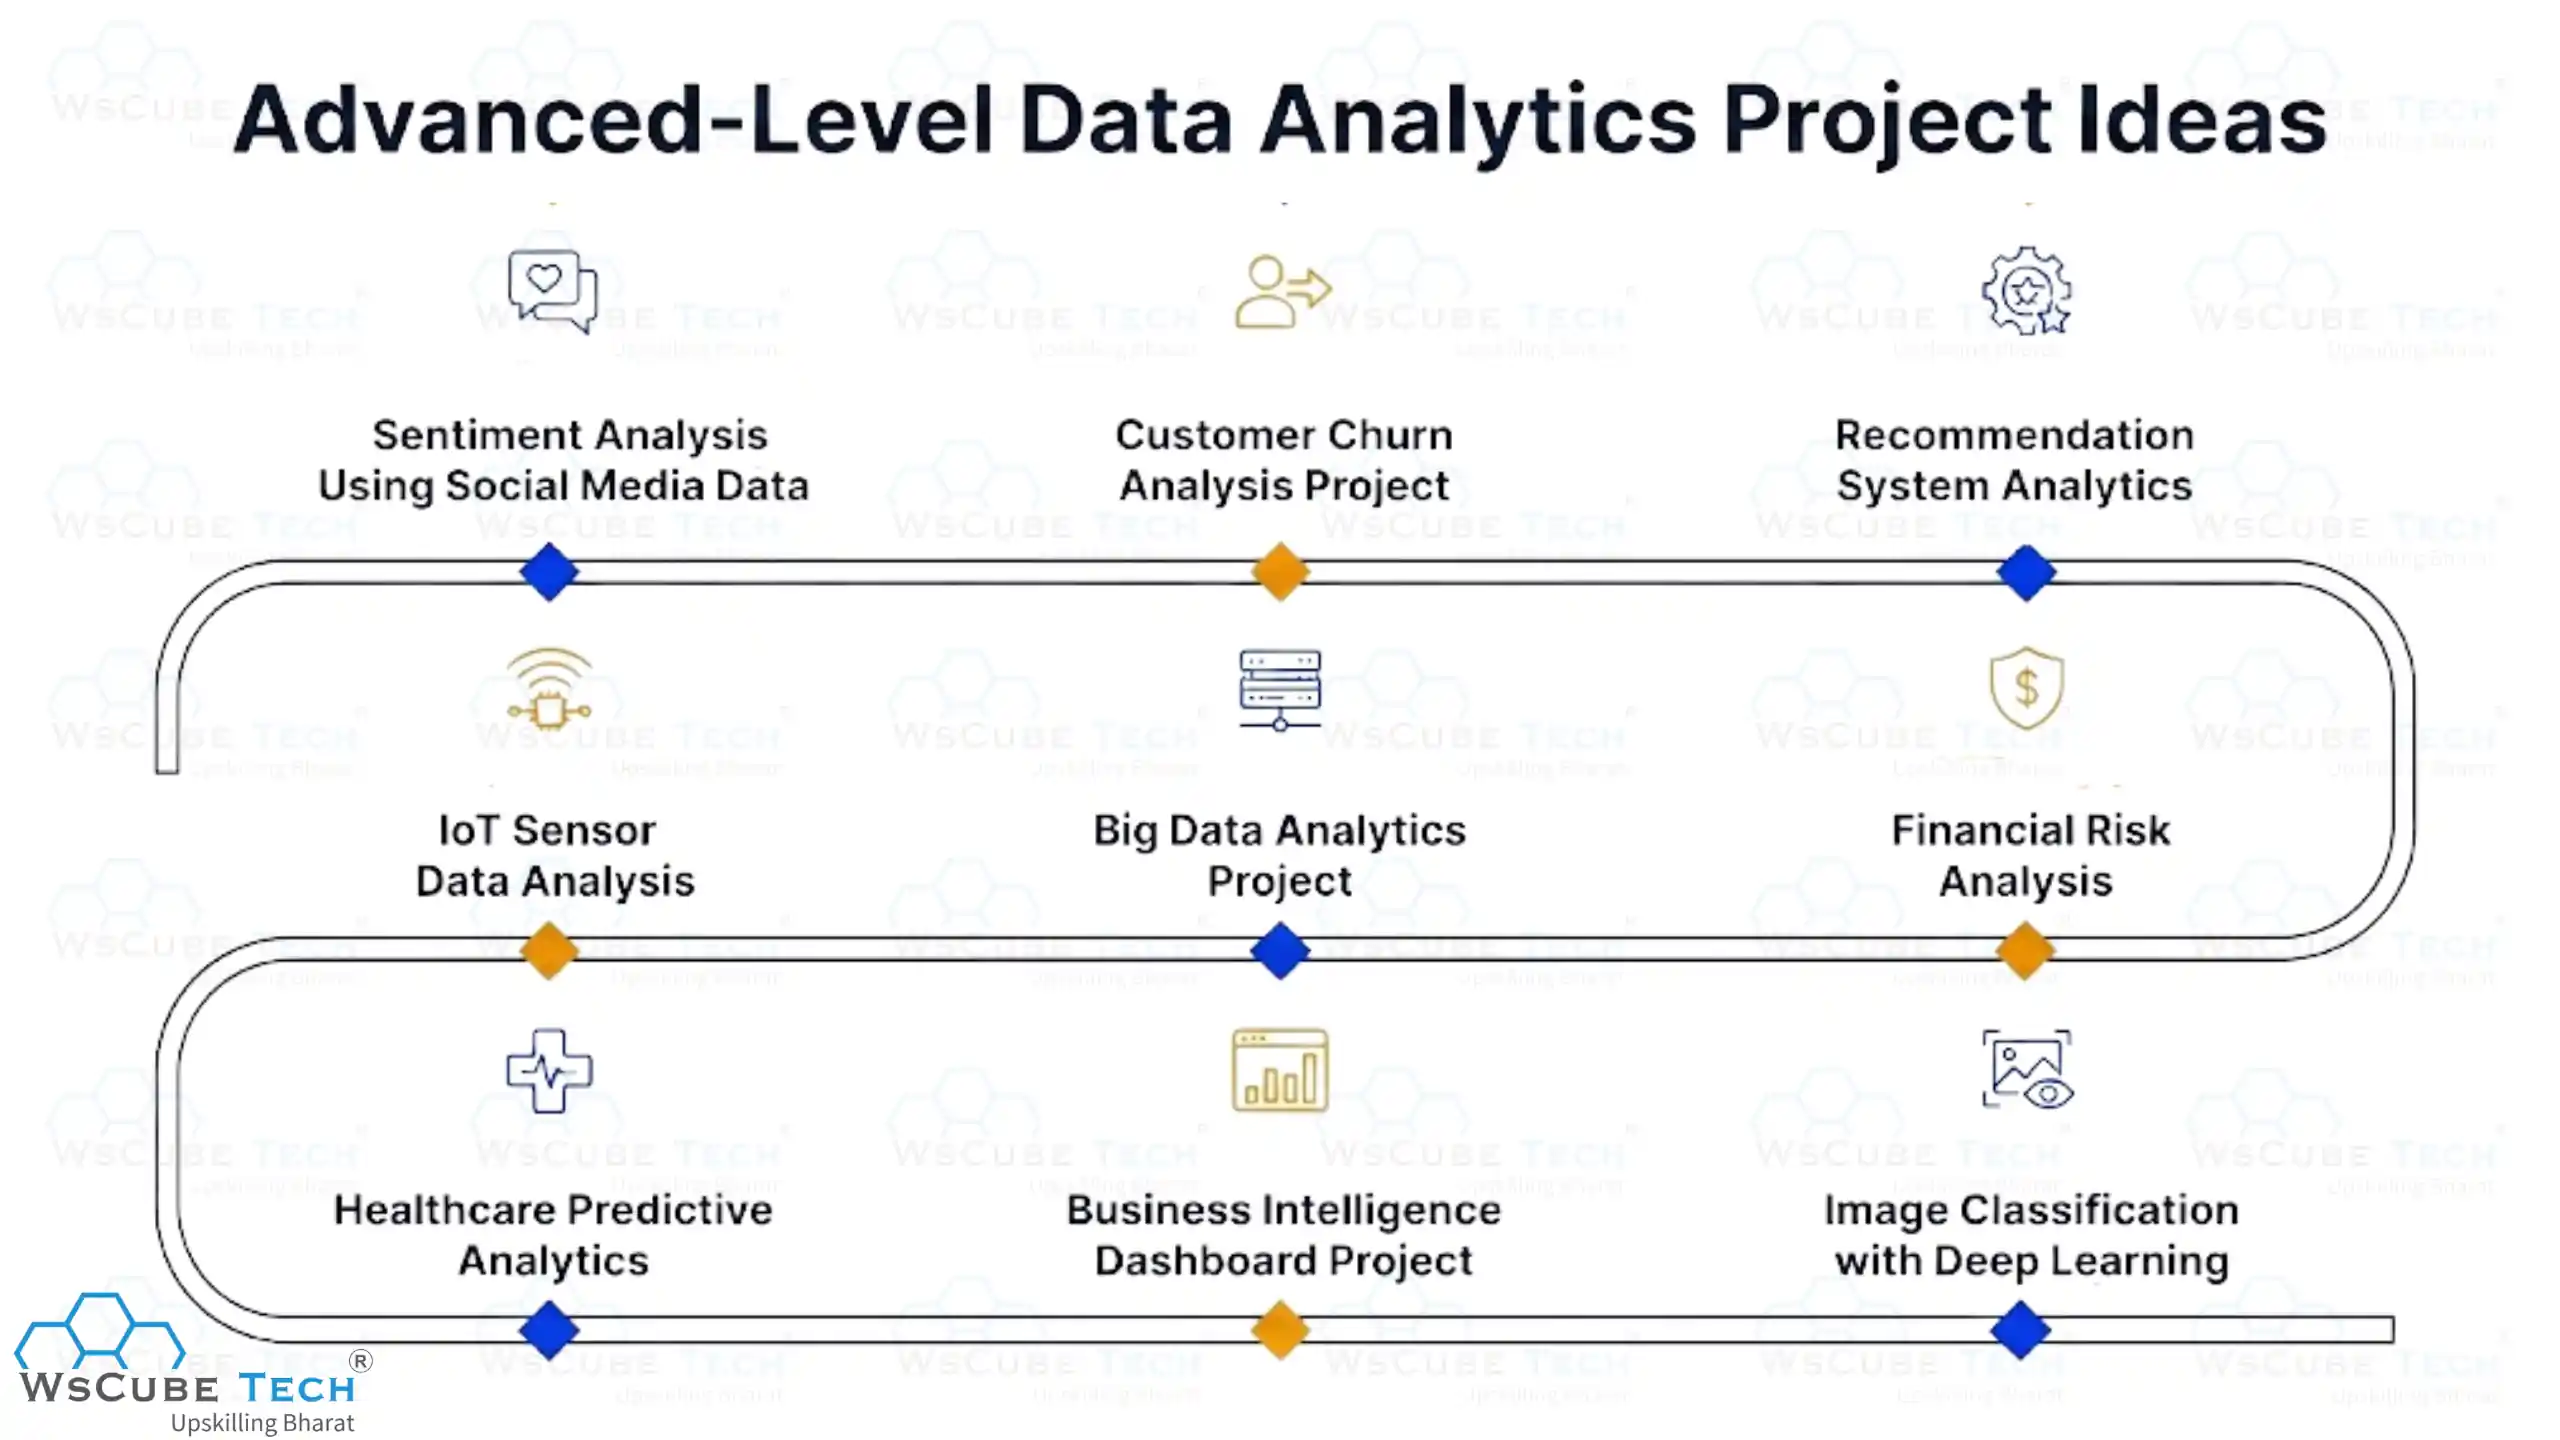
Advanced-Level Data Analytics Project Ideas
Below are some advanced data analytics projects that will help you master complex analysis, real-time data handling, and advanced decision-making skills:
1. Sentiment Analysis Using Social Media Data
The Sentiment Analysis Using Social Media Data project focuses on analyzing social media posts, comments, and reviews to understand public opinion, emotions, and audience sentiment. It helps you learn how businesses and brands use text data to track customer feedback, brand perception, and market trends.
How It Works
- Collect the social media dataset from a reliable source.
- Clean and preprocess the data if required.
- Analyze post text, comments, hashtags, likes, and timestamps.
- Classify sentiments as positive, negative, or neutral.
- Create charts and dashboards to visualize sentiment trends and audience reactions.
- Create reports with useful findings.
Skills You Practice
- Data preprocessing and cleaning
- Exploratory Data Analysis (EDA)
- Text and sentiment analysis
- Natural Language Processing (NLP)
- Data visualization
- Dashboard creation
Tools Used: Python, Jupyter Notebook, NLTK / TextBlob, Power BI, Tableau
Source Code: Sentiment Analysis Using Social Media Data
2. Customer Churn Analysis Project
The Customer Churn Analysis Project focuses on analyzing customer data to identify why users stop using a product or service. It helps you learn how businesses predict customer churn, understand risk factors, and improve customer retention strategies using data-driven insights.
How It Works
- Collect the customer churn dataset from a reliable source.
- Clean and preprocess the data if required.
- Analyze customer ID, subscription type, usage history, tenure, support tickets, and churn status.
- Study customer behavior and churn patterns.
- Create charts and dashboards to visualize churn trends and retention metrics.
- Create reports with actionable findings to improve customer retention.
Skills You Practice
- Data preprocessing and cleaning
- Exploratory Data Analysis (EDA)
- Customer churn analysis
- Predictive analysis
- Data visualization
- Dashboard creation
Tools Used: Excel, Python, SQL, Power BI, Tableau, Jupyter Notebook, Scikit-learn
Source Code: Customer Churn Analysis Project
3. Recommendation System Analytics
The Recommendation System Analytics project focuses on analyzing historical user data to generate personalized product or content recommendations. It uses machine learning models to study user behavior, preferences, and interactions for delivering smart suggestions. This project helps you understand how platforms like Netflix, Amazon, and Spotify improve user engagement through tailored recommendations.
How It Works
- Collect the user interaction dataset from a reliable source.
- Clean and preprocess the data if required.
- Explore user preferences, ratings, and behavior patterns using EDA.
- Prepare features for recommendation modeling.
- Train machine learning models to generate personalized recommendations.
- Evaluate model performance using recommendation metrics.
Skills You Practice
- Data preprocessing and cleaning
- Exploratory Data Analysis (EDA)
- User behavior analysis
- Machine learning modeling
- Recommendation system development
- Model evaluation
Tools Used: R, Python, Jupyter Notebook, Pandas, Scikit-learn, Surprise Library, Power BI
Source Code: Recommendation System Analytics
4. Financial Risk Analysis
The Financial Risk Analysis project focuses on analyzing financial data to identify potential risks, forecast losses, and support investment and business decisions. It helps you learn how banks, financial institutions, and businesses use data to manage credit risk, market risk, and operational risk.
How It Works
- Collect the financial dataset from a reliable source.
- Clean and preprocess the data if required.
- Analyze asset value, liabilities, credit score, interest rate, cash flow, and risk indicators.
- Study risk trends and financial patterns.
- Create charts and dashboards to visualize risk metrics and financial performance.
- Generate reports with useful findings and forecasts.
Skills You Practice
- Data preprocessing and cleaning
- Exploratory Data Analysis (EDA)
- Financial risk analysis
- Trend and predictive analysis
- Data visualization
- Dashboard creation
Tools Used: Excel, Python, SQL, Power BI, Tableau, Jupyter Notebook, Scikit-learn
Source Code: Financial Risk Analysis

5. Big Data Analytics Project
The Big Data Analytics Project focuses on analyzing large datasets to uncover patterns, trends, and valuable insights from high-volume data sources. It helps you understand how organizations process structured and unstructured data for smarter decision-making and business intelligence.
How It Works
- Collect large-scale data from reliable sources such as logs, transactions, and event records.
- Clean and preprocess the data to handle missing values and inconsistencies.
- Analyze user logs, transaction records, timestamps, and event-based data.
- Identify large-scale trends, patterns, and hidden relationships in the data.
- Create charts and dashboards to visualize processed information clearly.
- Generate reports with useful business intelligence findings.
Skills You Practice
- Data preprocessing and cleaning
- Exploratory Data Analysis (EDA)
- Big data processing
- Trend and pattern analysis
- Data visualization
- Dashboard creation
Tools Used: Python, SQL, Apache Spark, Hadoop, Power BI, Tableau, Jupyter Notebook
Source Code: Big Data Analytics Project
6. IoT Sensor Data Analysis
The IoT Sensor Data Analysis project focuses on analyzing real-time sensor data collected from smart devices, machines, or environmental systems. It helps you learn how industries use IoT data to monitor performance, detect anomalies, and make data-driven decisions in real time.
How It Works
- Collect real-time sensor data from smart devices or environmental systems.
- Clean and preprocess the data if required.
- Analyze sensor ID, timestamps, temperature, humidity, pressure, and device status.
- Study real-time trends and sensor behavior patterns.
- Create charts and dashboards to visualize live and historical sensor data.
- Generate reports for anomaly detection and performance analysis.
Skills You Practice
- Data preprocessing and cleaning
- Exploratory Data Analysis (EDA)
- Time-series forecasting
- Sensor data analysis
- Data visualization
- Dashboard creation
Tools Used: Python, SQL, Jupyter Notebook, Apache Kafka, Power BI, Tableau, IoT Platforms (AWS IoT / Azure IoT)
Source Code: IoT Sensor Data Analysis
7. Healthcare Predictive Analytics
The Healthcare Predictive Analytics project focuses on analyzing medical and patient data to predict health risks, disease outcomes, hospital readmissions, and treatment effectiveness. It helps you learn how healthcare organizations use predictive models to improve patient care and support better medical decisions.
How It Works
- Collect healthcare and patient data from a reliable source.
- Clean and preprocess the data if required.
- Analyze patient age, medical history, diagnosis, treatment records, and outcome status.
- Build predictive models to identify health risks and future outcomes.
- Create charts and dashboards to visualize predictions and patient trends.
- Generate reports with useful healthcare findings.
Skills You Practice
- Data preprocessing and cleaning
- Exploratory Data Analysis (EDA)
- Predictive analytics
- Healthcare data analysis
- Data visualization
- Dashboard creation
Tools Used: Python, SQL, Jupyter Notebook, Scikit-learn, Power BI, Tableau
Source Code: Healthcare Predictive Analytics
8. Business Intelligence Dashboard Project
The Business Intelligence Dashboard Project focuses on analyzing business data to track KPIs, sales performance, customer insights, and operational trends through interactive dashboards. It helps you learn how organizations use business intelligence tools to make data-driven decisions and improve overall performance.
How It Works
- Collect business data from a reliable source.
- Clean and preprocess the data if required.
- Analyze sales, revenue, profit, customer metrics, and KPI indicators.
- Study business trends and performance metrics.
- Create interactive dashboards to visualize KPIs and overall performance.
- Generate reports with useful business recommendations.
Skills You Practice
- Data preprocessing and cleaning
- Exploratory Data Analysis (EDA)
- KPI and business analysis
- Dashboard development
- Data visualization
- Reporting and insights
Tools Used: Excel, SQL, Power BI, Tableau, Python, Jupyter Notebook
Source Code: Business Intelligence Dashboard Project
9. Image Classification with Deep Learning
The Image Classification project focuses on analyzing image data to automatically classify images into different categories or labels. It helps you learn how computer vision and machine learning models are used to identify objects, faces, products, animals, and other visual elements from images.
How It Works
- Collect the image dataset from a reliable source.
- Preprocess images through resizing, normalization, and cleaning.
- Analyze image pixels, labels, and class categories.
- Train a deep learning model such as a CNN on the dataset.
- Predict the correct image category using the trained model.
- Generate accuracy and performance reports for evaluation.
Skills You Practice
- Image preprocessing
- Data augmentation
- Computer vision basics
- Deep learning modeling (CNN)
- Model evaluation
- Data visualization
Tools Used: Python, Jupyter Notebook, TensorFlow, Keras, OpenCV, NumPy, Matplotlib
Source Code: Image Classification with Deep Learning
Tips to Choose the Right Data Analytics Project
Below are the best tips to help you choose the right data analytics project based on your skill level, career goals, and learning objectives:
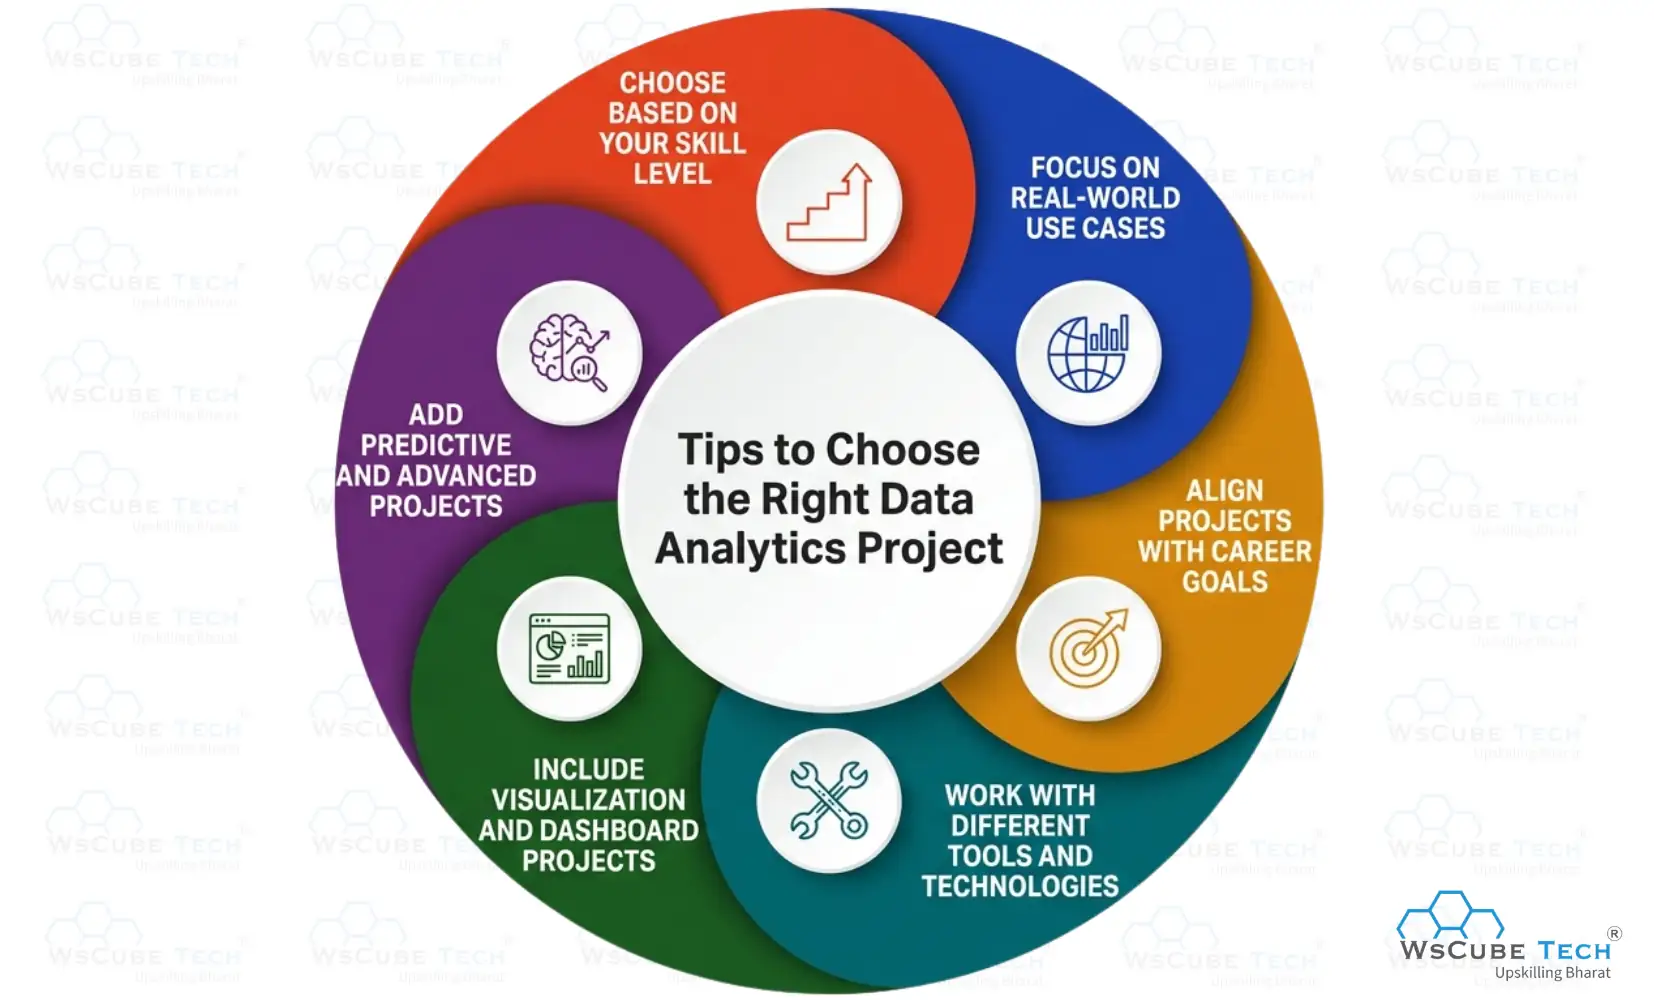
- Choose Based on Your Skill Level: Start with beginner-friendly projects like sales or student performance analysis, then move to intermediate and advanced topics. This helps you build confidence and gradually work on the best projects for data analytics.
- Focus on Real-World Use Cases: Select projects that solve practical business problems such as customer churn, fraud detection, or inventory analysis. Real-world projects strengthen problem-solving abilities and make your portfolio more valuable to recruiters.
- Align Projects with Career Goals: Choose projects related to the field you want to enter, such as finance, healthcare, marketing, or e-commerce. Relevant projects make excellent data analyst projects for resume and showcase domain-specific expertise.
- Work with Different Tools and Technologies: Pick projects that allow you to use Excel, SQL, Python, Power BI, and Tableau. This helps build technical versatility and demonstrates hands-on experience with industry-standard data analytics tools.
- Include Visualization and Dashboard Projects: Projects with interactive dashboards and clear reports improve your storytelling skills with data, making it easier to communicate insights and business recommendations effectively.
- Add Predictive and Advanced Projects: Once your basics are clear, choose projects involving machine learning, predictive analytics, or recommendation systems to show advanced analytical and modeling capabilities.
Working on data analytics projects helps you learn, but having proper guidance makes everything much easier. If you want to understand concepts clearly, work on real projects, and become job-ready faster, you can try WsCube Tech’s data analytics course. It gives you a simple, step-by-step way to learn and build your skills with confidence while staying consistent in your journey.
Also Read: Data Analyst Roadmap: Step-by-Step Guide for Beginners
FAQs About Data Analytics Projects
The best beginner projects include sales analysis, student performance analysis, website traffic analysis, and customer segmentation. These projects help build foundational skills in data cleaning, visualization, reporting, and basic trend analysis.
Choose a project based on your current skill level, career goals, and interest area. Start with simple datasets and gradually move to domain-specific projects such as finance, healthcare, marketing, or business intelligence.
Common tools include Excel, SQL, Python, Power BI, Tableau, and Jupyter Notebook. Depending on the project, you may also use libraries like Pandas, NumPy, Matplotlib, and Scikit-learn for advanced analysis.
Yes, data analytics projects are highly important for freshers because they demonstrate practical knowledge, problem-solving ability, and hands-on experience, helping recruiters evaluate your skills even if you do not have work experience.
You can find datasets on platforms like Kaggle, UCI Machine Learning Repository, Google Dataset Search, government open data portals, and GitHub repositories that provide real-world datasets for practice projects.
A strong data analyst portfolio should include 4 to 6 high-quality projects that showcase skills such as data cleaning, data visualization, SQL queries, dashboard development, and business insight generation.
Projects that solve real-world business problems, include clear visualizations, actionable insights, dashboards, and a proper explanation of findings stand out more to recruiters and strengthen your chances during hiring.
Yes, beginners can start with tools like Excel, Google Sheets, and Power BI without coding. However, learning SQL and Python later helps build stronger technical skills and unlock better opportunities in data analytics.
Present your project with a clear title, tools used, dataset source, problem statement, methods applied, and key results. Focus on measurable insights, dashboards, and business recommendations to make it stronger.
A beginner project usually takes 3 to 7 days, while intermediate and advanced projects may take 1 to 3 weeks depending on dataset complexity, tools used, and dashboard or modeling requirements.
Industries like finance, healthcare, e-commerce, marketing, education, and supply chain offer excellent project ideas because they generate large datasets and require data-driven insights for decision-making and performance improvement.
Using real-world datasets is highly recommended because it improves practical understanding, exposes you to real data challenges, and makes your portfolio more relevant and attractive to recruiters and hiring managers.
Explain the problem statement, dataset used, tools applied, steps followed, insights discovered, and business impact. Keep the explanation simple, structured, and focused on the decisions made using the analysis.
Data analytics projects help you learn data cleaning, SQL, Python, visualization, dashboard creation, trend analysis, reporting, problem-solving, and business decision-making skills that are valuable for real-world roles.
Conclusion
Data analytics projects are one of the best ways to build practical skills and gain hands-on experience with real-world data. From beginner-level analysis to advanced dashboards, machine learning, and predictive models, these projects strengthen problem-solving skills and improve your understanding of how data is used across industries.
By working on these projects, you can build a strong portfolio, improve your technical knowledge, and prepare for real-world roles in analytics, business intelligence, and data science. They not only boost your confidence but also help you apply concepts in a practical and job-ready way.
Join Our On-Campus Data Analytics Program


Leave a comment
Your email address will not be published. Required fields are marked *Comments (0)
No comments yet.