Data analysis focuses on studying data to understand patterns, trends, and useful information that support better decision-making. A data analyst works with tools like Excel, SQL, and visualization dashboards to turn raw data into clear and meaningful reports. This role helps organizations track performance, understand results, and plan actions based on data. For beginners, learning data analysis without proper guidance can feel confusing, which is why a structured data analyst roadmap is helpful from the start.
This data analyst roadmap provides a clear and step-by-step learning path for beginners and aspiring professionals. It explains what skills to learn first, how different tools are connected, and how to gain practical experience. By following this roadmap, learners can build strong foundations, stay focused, and prepare confidently for real-world data analyst roles.
Who is a Data Analyst?
A Data Analyst is a professional who works with data to help organizations make better decisions. They collect, organize, and analyze data to identify patterns and trends. Using tools like Excel, SQL, and data visualization software, data analysts turn raw data into clear and easy-to-understand reports.
Data analysts play an important role in helping teams track performance, solve problems, and plan future strategies. Their work is based on reliable data and logical analysis, ensuring decisions are driven by facts rather than assumptions.
Also Read: Data Analyst Job Description: Responsibilities and Skills
Key Responsibilities of a Data Analyst
- Collect, clean, and prepare data from multiple sources to ensure accuracy, consistency, and reliability before analysis
- Analyze datasets to identify trends, patterns, and insights for better decision-making
- Write and maintain SQL queries to retrieve, join, and summarize data efficiently
- Create clear reports, dashboards, and visualizations that present data in an easy-to-understand format
- Translate complex analytical results into simple, actionable insights for business and non-technical teams
- Monitor data quality, fix errors, and ensure reliable analysis results
- Collaborate with stakeholders to understand requirements and align insights with business goals
- Support daily operations and long-term strategies using data-driven recommendations
If you want to learn more, Check out: What Does a Data Analyst Do?
Core Skills and Tools Required for a Data Analyst
To succeed as a data analyst, you need a balanced mix of analytical skills, technical knowledge, and business understanding. These skills help you collect data, analyze it effectively, and communicate insights that support decision-making.
| Skill Category | Key Tools | Why It Matters in 2026 |
| Data Cleaning & Preparation | Excel, Python (Pandas) | Real-world data is often messy and must be cleaned before meaningful analysis |
| Data Querying & Databases | SQL, MySQL, PostgreSQL | Efficient querying is essential for working with large datasets |
| Programming & Analysis | Python, R | Enables advanced analysis, automation, and scalable workflows |
| Statistics & Logic | Excel, Python (NumPy) | Helps interpret trends, patterns, and data accuracy |
| Data Visualization & BI | Power BI, Tableau | Converts complex data into easy-to-understand visuals |
| Business & Communication | Reports, Dashboards | Ensures insights are clearly explained to stakeholders |
Mastering these core skills and tools builds a strong foundation and prepares you for real-world data analyst roles in today’s data-driven industries.
Recommended Professional Certificates
Data Analytics Mentorship Program
Data Science & AI Mentorship Program
Domain Specializations for Data Analysts in 2026
With the rise of data-driven businesses, companies in 2026 prefer data analysts who specialize in specific domains and understand real industry challenges. Below are some key domains to explore.
- Business Analytics: Focuses on improving business processes, tracking performance, and supporting strategic decisions. Analysts work with KPIs, sales data, operational metrics, and dashboards to improve efficiency and growth.
- Marketing Analytics: Involves studying customer behavior, campaign performance, SEO, and conversion data to improve marketing strategies and increase return on investment.
- Financial Analytics: Focuses on analyzing revenue, expenses, profitability, and financial trends. Analysts support budgeting, forecasting, and financial planning using financial and transactional data.
- Healthcare Analytics: Concentrates on analyzing healthcare data to improve patient outcomes, operational efficiency, and resource planning. Analysts work with clinical and operational data while maintaining accuracy and compliance.
- Cloud & Big Data Analytics: Deals with analyzing large-scale datasets stored on cloud platforms. Analysts use tools such as BigQuery, Snowflake, and cloud analytics services to efficiently manage high-volume data.
Choosing a domain specialization allows data analysts to build expertise, stand out in the job market, and grow into advanced roles with higher responsibility and impact in 2026 and beyond. Following a clear roadmap of data analyst skills helps learners choose the right domain and plan their long-term career growth effectively.
Data Analyst Roadmap: Step-by-Step Learning Guide
This roadmap for data analysts provides a clear, step-by-step learning path that helps beginners understand what to learn, the correct order to follow, and how skills connect to real-world data analysis.
Below are the steps that help you become a skilled data analyst:
- Understand the Basics of Data and Analytics
- Learn Basic Mathematics and Statistics
- Master Excel for Data Analysis
- Learn SQL for Data Querying and Reporting
- Choose a Programming Language (Python or R)
- Learn Data Cleaning and Preparation
- Learn Data Visualization Principles
- Work with BI Tools (Power BI or Tableau)
- Perform Exploratory Data Analysis (EDA)
- Understand Business and Domain Knowledge
- Build Real-World Projects and a Portfolio
- Prepare for Data Analyst Jobs and Interviews
Now, we will go through each step one by one to clearly explain what you should learn, which key concepts to focus on, and how each step helps you grow as a confident data analyst.
Step 1: Understand the Basics of Data and Analytics
This step builds the foundation of your data analyst journey. You learn what data is, how it is collected, and how analytics transforms raw information into meaningful insights that support better decisions across industries.
- What is Data: Understand structured, semi-structured, and unstructured data, along with common data types like numerical, categorical, and text data.
- Types of Analytics: Learn descriptive, diagnostic, predictive, and prescriptive analytics, and how each type answers different business questions.
- Data Sources: Explore data from databases, spreadsheets, surveys, websites, sensors, and APIs.
- Basic Statistics: Learn mean, median, mode, percentages, variance, and data distribution to summarize information clearly.
- Data Lifecycle: Understand how data is collected, stored, processed, analyzed, and reported.
- Data Ethics and Privacy: Learn the importance of data accuracy, security, user privacy, and responsible data usage.
Understanding these basics helps you think analytically, ask the right questions, and prepare for working with real-world data in later steps of the data analyst roadmap.
Also Read: Data Analyst Salary in India (Freshers & Experienced)
Step 2: Learn Basic Mathematics and Statistics
After understanding what data is and how analytics works, the next step is to build your mathematical and statistical foundation. These concepts help you analyze data correctly, understand patterns, and avoid wrong conclusions when working with real-world datasets.
- Arithmetic Basics: Learn percentages, ratios, averages, and proportions commonly used in everyday data analysis.
- Algebra Fundamentals: Understand variables, equations, and simple formulas to explain relationships between data values.
- Descriptive Statistics: Study mean, median, mode, range, and standard deviation to summarize and compare data effectively.
- Data Distribution: Learn about normal distribution, skewness, and outliers to understand how data is spread.
- Probability Basics: Understand basic probability concepts to measure uncertainty and likelihood.
- Correlation and Trends: Learn how variables are related and how they move together over time.
Learning these concepts helps you analyze data with accuracy, avoid common mistakes, and make confident, data-driven interpretations in real-world scenarios.
Upcoming Masterclass
Attend our live classes led by experienced and desiccated instructors of Wscube Tech.

Step 3: Master Excel for Data Analysis
Excel is one of the most widely used tools in data analysis and is often the first tool you will use in real-world projects. It helps you organize data, perform calculations, analyze trends, and create reports without complex programming. Strong Excel skills make data handling faster and more efficient.
- Excel Basics: Learn worksheets, cells, data types, and formatting to keep data clean and organized.
- Formulas and Functions: Use functions such as SUM, AVERAGE, IF, VLOOKUP/XLOOKUP, COUNT, and logical formulas for calculations and analysis.
- Data Cleaning: Remove duplicates, handle missing values, and apply text functions to improve data quality.
- Sorting and Filtering: Quickly analyze specific data using filters, conditions, and sorting options.
- Pivot Tables: Summarize large datasets and extract meaningful insights with ease.
- Charts and Visuals: Create bar charts, line charts, and simple dashboards for clear and effective reporting.
Mastering Excel allows you to analyze data efficiently, present insights clearly, and build a strong base for advanced analytics tools.
Step 4: Learn SQL for Data Querying and Reporting
Once you are comfortable working with Excel and understanding how data is structured, the next essential skill is SQL. Most real-world data is stored in databases, and SQL allows you to retrieve, analyze, and summarize data efficiently to support better decision-making.
- SQL Basics: Understand tables, rows, columns, and write basic SELECT queries to retrieve data.
- Filtering Data: Use WHERE, AND, OR, BETWEEN, LIKE, and IN to narrow down results.
- Sorting and Limiting: Apply ORDER BY and LIMIT to control and organize output.
- Aggregations: Use COUNT, SUM, AVG, MIN, and MAX with GROUP BY to summarize data.
- Joins: Combine data from multiple tables using INNER, LEFT, RIGHT, and FULL joins.
- Subqueries: Nested queries for complex data analysis.
- Reporting Queries: Writing clean, optimized queries for dashboards and reports.
Databases to Know
MySQL and PostgreSQL are popular relational databases used to store, manage, and query structured data efficiently.
Learning SQL helps you confidently work with real-world databases, analyze large datasets, and convert raw data into meaningful insights that support informed business decision-making.
Step 5: Choose a Programming Language (Python or R)
While Excel and SQL are useful for managing and querying data, a programming language is needed for deeper analysis, automation, and advanced visualizations. Programming allows you to work with large datasets efficiently and perform tasks that are difficult to handle manually. The two most common choices are Python and R.
Python / R
- Python: Easy to learn and widely used in data analysis, automation, and machine learning. It offers a rich set of libraries, strong community support, and is commonly used in real-world industry projects.
- R: Mainly used for statistics, research, and data modeling. It is popular in academic and research-focused roles that require advanced statistical analysis.
How to choose the right one
Choosing one language first is important for focused learning. If your goal includes automation, data science, or machine learning, Python is the better option. If you are more interested in statistics, research, or data modeling, R is a good choice.
Key libraries to learn
For Python:
- Pandas: Used to clean, manipulate, and analyze structured data efficiently.
- NumPy: Helps perform numerical calculations and work with arrays.
- Matplotlib: Creates basic charts and visualizations for analysis.
- Seaborn: Builds clear and attractive statistical data visuals.
- SciPy: Supports advanced statistics and scientific calculations.
For R:
- dplyr: Simplifies data manipulation and filtering tasks.
- ggplot2: Creates powerful and customizable visualizations.
- tidyr: Organizes messy data into a clean format.
- caret: Helps build and evaluate machine learning models.
- data.table: Handles large datasets quickly and efficiently
Learning these libraries helps you analyze data faster, automate workflows, and perform effective data analysis in real-world projects.
Read More Career Roadmaps
Step 6: Learn Data Cleaning and Preparation
Once you start working with real datasets, you will quickly notice that data is often incomplete, messy, or inconsistent. Data cleaning and preparation help you fix these issues so your analysis is accurate and reliable. This step focuses on improving data quality before any analysis begins.
- Handling Missing Data: Identify missing values and manage them using techniques such as removal, replacement with averages or defaults, or estimation based on existing data.
- Removing Duplicates: Find and eliminate repeated records to avoid incorrect or misleading results.
- Correcting Errors: Fix incorrect values, spelling mistakes, inconsistent units, and formatting issues caused by manual data entry or system errors.
- Standardizing Data: Ensure consistent formats for dates, text, and numerical values across datasets.
- Outlier Detection: Identify unusually high or low values that may affect trends, averages, or overall analysis.
- Data Transformation: Convert raw data into a usable format for analysis and visualization.
Learning data cleaning and preparation helps you build trustworthy datasets, improve analysis accuracy, and produce meaningful insights from real-world data.
Step 7: Learn Data Visualization Principles
After cleaning and preparing data, the next step is to present insights in a clear and meaningful way. Data visualization helps you communicate findings using charts and visuals that are easy to understand and support better decision-making.
- Choosing the Right Chart: Use bar charts, line charts, pie charts, and scatter plots based on the data type and purpose.
- Understanding Visual Design: Learn the proper use of colors, labels, scales, spacing, and layout to improve clarity and readability.
- Telling a Data Story: Present insights in a logical flow that highlights key trends and important findings.
- Avoiding Misleading Visuals: Use accurate scales, clear labels, and honest representations to prevent misinterpretation of data.
- Design for the Audience: Customize visuals to match the understanding level of both technical and non-technical viewers.
Strong data visualization skills help you present insights clearly, tell meaningful data stories, avoid confusion, and communicate findings effectively to both technical and non-technical audiences for better decision-making.
Also Read: How to Become Data Analyst? Skills, Qualifications
Step 8: Work with BI Tools (Power BI or Tableau)
Once you understand data visualization principles, the next step is to use professional BI tools to create interactive reports and dashboards. Power BI and Tableau help you combine data, build dynamic visuals, and share insights clearly with stakeholders.
- Power BI: Widely used in businesses to create interactive dashboards, connect multiple data sources, and enable real-time reporting.
- Tableau: Known for powerful visualizations and easy drag-and-drop features that allow quick visual data exploration.
- Data Connections: Connect data from Excel files, databases, cloud platforms, and APIs.
- Dashboard Design: Build interactive dashboards using filters, slicers, and drill-down options.
- Sharing Insights: Publish reports and share them securely with teams and decision-makers.
Working with BI tools helps you present data professionally, support informed business decisions, and become job-ready as a data analyst.
Step 9: Perform Exploratory Data Analysis (EDA)
Exploratory Data Analysis (EDA) focuses on understanding data in depth by examining its structure, patterns, and relationships. This step helps you gain clear insights, detect issues early, and decide the right direction for further analysis.
- Understanding the Dataset: Review the dataset size, columns, data types, data ranges, and overall structure to know what the data represents.
- Summary Statistics: Use mean, median, standard deviation, and ranges to understand data behavior.
- Data Visualization: Create histograms, box plots, and scatter plots to observe distributions and patterns.
- Relationship Analysis: Explore correlations and interactions between variables to understand how different data points are related.
- Outlier Detection: Identify unusual values that may affect analysis results.
- Insight Discovery: Identify trends, anomalies, and key observations that guide deeper analysis.
Performing EDA helps you understand your data better, ask meaningful questions, and build accurate, insight-driven analysis for real-world decision-making.

Step 10: Understand Business and Domain Knowledge
Understanding business and domain knowledge is essential for turning data analysis into meaningful insights. This step helps you connect data findings with real business goals, industry processes, and decision-making needs.
- Business Fundamentals: Learn how businesses operate, including revenue models, costs, profit, growth metrics, and key performance indicators (KPIs).
- Domain Understanding: Gain in-depth knowledge of the industry you work in, such as finance, healthcare, marketing, retail, or technology, to understand industry-specific data and challenges.
- Business Questions: Learn how to translate business problems into clear data questions and analysis goals.
- Contextual Analysis: Interpret data within the correct business context to avoid incorrect assumptions or misleading conclusions.
- Stakeholder Needs: Understand what decision-makers expect and how insights can support their objectives.
- Actionable Insights: Focus on insights that lead to practical actions, improvements, and measurable business impact rather than just numbers.
Strong business and domain knowledge help you align data analysis with real-world needs, communicate insights effectively, and deliver value-driven results as a data analyst.
Step 11: Build Real-World Projects and a Portfolio
Building real-world projects is one of the most important steps in becoming a data analyst. Projects help you apply your skills to real problems, work with real datasets, and demonstrate how you clean data, analyze trends, and present insights. A strong portfolio shows your practical abilities, builds confidence, and increases your chances of getting noticed by recruiters and hiring managers.
You can check 20+ Data Analytics Projects that help you practice different tools, gain hands-on experience, and build portfolio-ready projects based on real industry scenarios.
Step 12: Prepare for Data Analyst Jobs and Interviews
Preparing for data analyst jobs involves refining your analytical skills and understanding industry expectations. Focus on strengthening Excel, SQL, data cleaning, data visualization, and basic statistics while practicing real-world datasets and problem-solving scenarios.
Build a strong portfolio that showcases your best data analysis projects, clear insights, dashboards, and well-documented work. Practice common interview questions, SQL queries, case studies, and business problem-solving to improve confidence and communication during interviews.
You can explore the Data Analytics Course to learn data analysis in a structured way. This program offers step-by-step guidance, real-world projects, expert mentorship, and job-ready skills that help you confidently start your data analyst career.
Career Opportunities After Learning Data Analysis
After learning data analysis, many career options become available across industries.
- Data Analyst: Work with datasets to clean, analyze, and interpret data, create reports and dashboards, and deliver actionable insights that support informed business decisions.
- Business Analyst: Focus on understanding business requirements, analyzing data trends, and translating insights into actionable strategies for stakeholders.
- Data Visualization Analyst: Specialize in designing dashboards and visual reports that transform complex data into clear, meaningful stories, helping decision-makers quickly understand trends, patterns, and insights.
- Operations Analyst: Use data to improve operational efficiency, monitor performance, reduce costs, and support planning and optimization efforts.
- Marketing Analyst: Analyze customer behavior, campaign performance, and market trends to improve marketing strategies and return on investment.
With continuous learning and hands-on projects, data analysis offers strong career growth, flexibility, and opportunities across startups, enterprises, and global organizations.
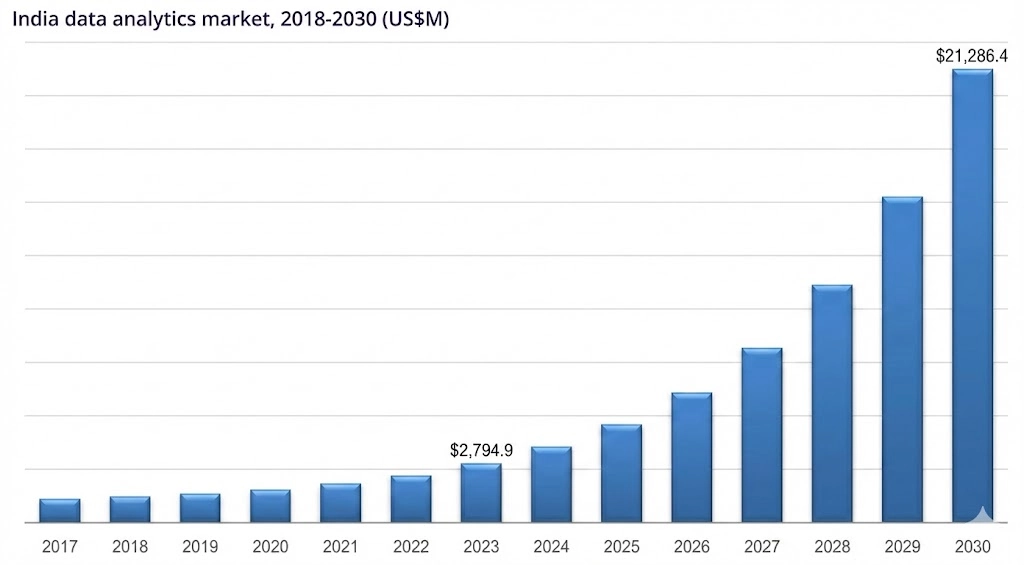
Data Analyst Demand and Salary in India (2026)
The data analytics market in India is growing rapidly, making data analyst skills highly sought after. According to Grand View Research, the India data analytics market is expected to grow from about USD 3.55 billion in 2024 to USD 21.29 billion by 2030, with a strong 35.8 % CAGR from 2025 to 2030, reflecting rising demand for analytics solutions and professionals.
In India, companies across sectors, including IT, finance, e-commerce, healthcare, and consulting, are hiring data analysts to help turn large datasets into actionable business insights. Skills in SQL, Excel, BI tools, Python, and visualization significantly boost job opportunities and career growth.
Data Analyst Salary in India
| Experience Level | Average Salary Range |
| Fresher (0–2 years) | ₹4 LPA – ₹7 LPA |
| Mid-Level (2–5 years) | ₹7 LPA – ₹10 LPA |
| Experienced (5+ years) | ₹9 LPA – ₹15 LPA+ |
With rising data adoption, strong market growth, and opportunities across startups, enterprises, and global companies, data analysis remains a stable and rewarding career choice in India for 2026 and beyond.
Data Analyst Roadmap 2026 (Detailed Video Guide)
FAQs About Data Analyst Roadmap
A data analyst is someone who helps you understand data by collecting, cleaning, and analyzing it. You turn raw numbers into clear insights that help businesses make better decisions using reports, dashboards, and visualizations.
Yes, a data analyst roadmap is suitable for beginners because it guides you step by step. You avoid confusion, focus on the right skills, and build knowledge gradually instead of jumping randomly between tools and topics.
The time depends on your learning speed and consistency. If you practice regularly, you can follow a data analyst roadmap step by step and become job-ready within 6 to 9 months, including projects and basic real-world experience.
You do not need advanced coding at the start, but basic programming helps a lot. Learning SQL and Python as part of a data analyst learning roadmap allows you to analyze data faster, handle large datasets, and automate repetitive analysis tasks.
You do not strictly need a degree to become a data analyst. If you build strong skills in Excel, SQL, data analysis, and projects, employers often value practical experience, problem-solving ability, and a solid portfolio over formal education.
Absolutely. Our data analyst roadmap is designed for freshers and beginners. You start with fundamentals like data basics, Excel, and statistics, then move to SQL, visualization, and real-world projects. This structured approach helps you build practical skills, gain confidence, and prepare effectively for entry-level data analyst job opportunities.
You should start with Excel and basic statistics, then move to SQL for databases. After that, learning Python and BI tools like Power BI or Tableau completes the roadmap for data analyst roles and prepares you for real-world work.
Yes, you can switch careers using a data analytics roadmap. It provides a clear, step-by-step learning path, helps you build practical skills, work on real projects, and confidently transition from non-technical or different professional backgrounds into data analytics roles.
In India, data analyst salaries vary by skills, experience, and location. Entry-level roles offer ₹4–6 LPA, while professionals with strong skills and experience can earn significantly higher salaries.
Yes, a roadmap of data analyst helps you prepare systematically. You gain clear knowledge of tools, concepts, and projects, which improves confidence and helps you answer interview questions with real examples and structured explanations.
Data analysis is a strong career choice in 2026 because companies rely heavily on data-driven decisions. With a clear data analyst roadmap and continuous learning, you can access high-demand roles and long-term career growth.
Read More Blogs Topics


Leave a comment
Your email address will not be published. Required fields are marked *Comments (0)
No comments yet.