
Business analytics helps companies understand their data and make better decisions. Instead of guessing, businesses now use data to find what is working and what is not. From tracking past performance to predicting future trends, business analytics plays an important role in every industry.
There are different types of business analytics, and each one serves a unique purpose. Some focus on analyzing past data, while others help in forecasting or suggesting the next best action. In this blog, we will explore the main types of business analytics in a simple way with examples.
Types of Business Analytics
Before we go deep into each type, here is a quick summary of the 4 types of business analytics:
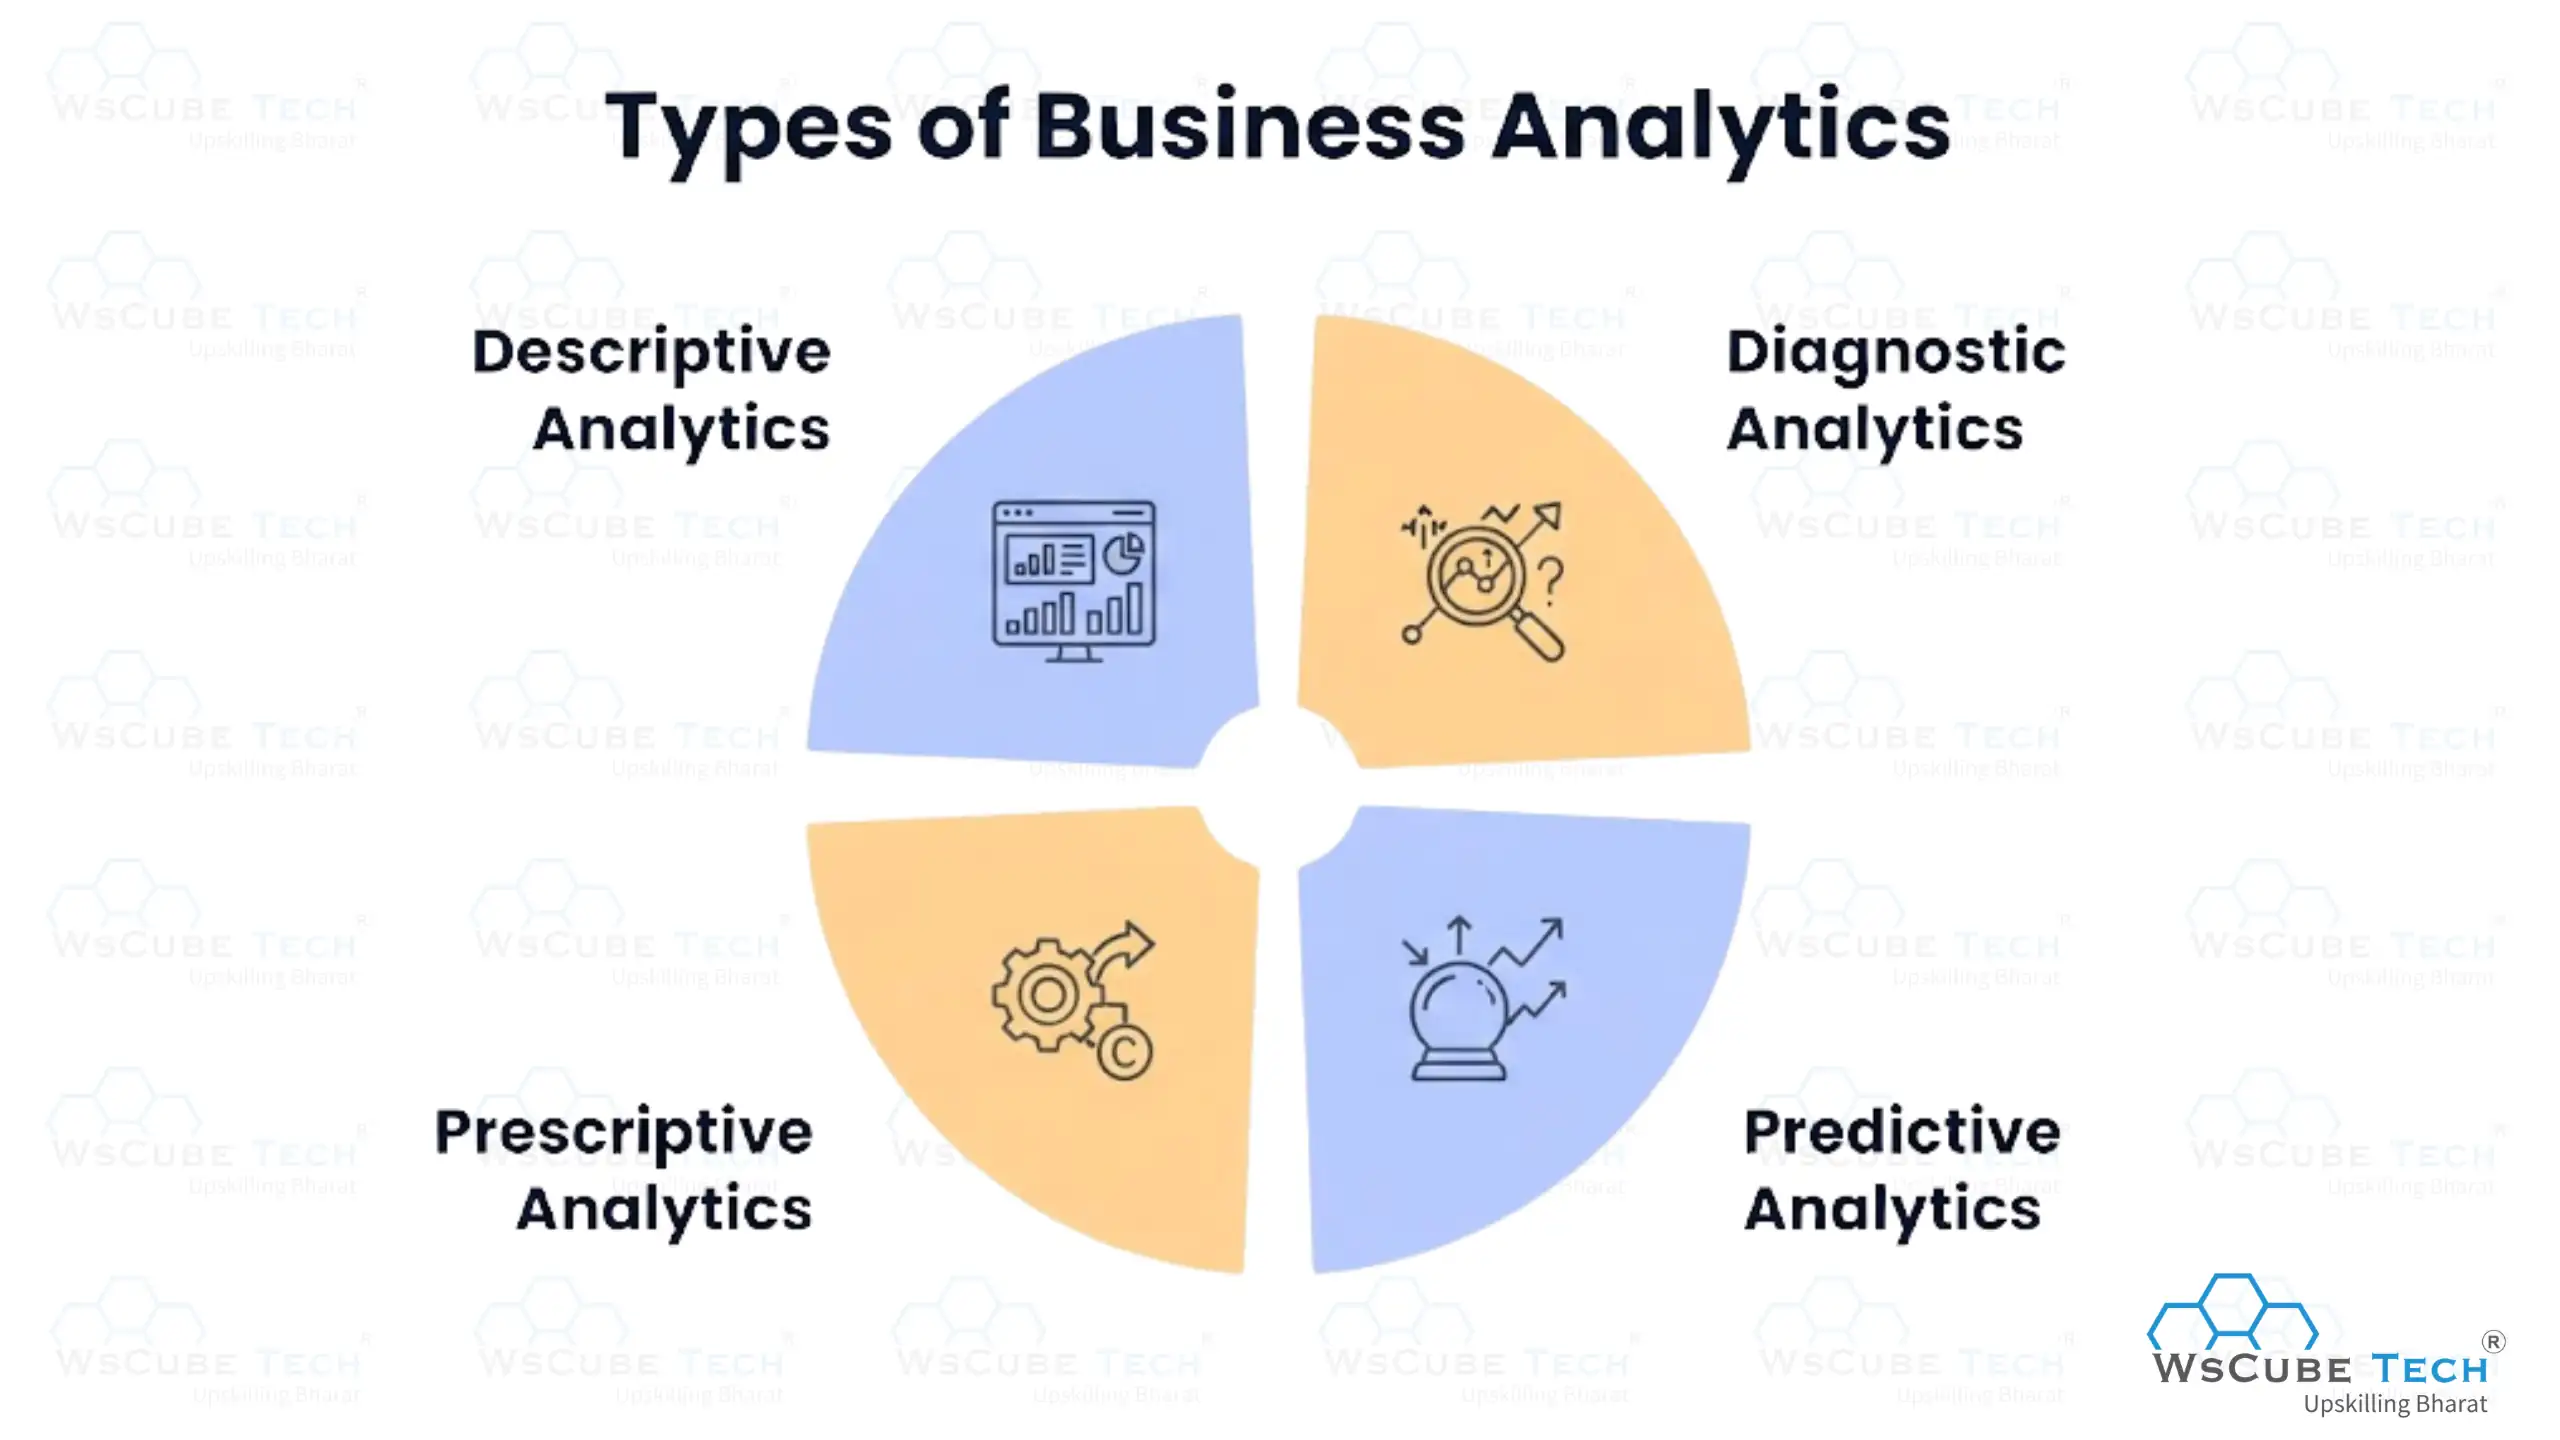
- Descriptive Analytics – Looks at past data to understand what happened.
- Diagnostic Analytics – Digs deeper into the data to understand why it happened.
- Predictive Analytics – Uses historical patterns to forecast what will happen next.
- Prescriptive Analytics – Recommends what action should be taken based on the data.
Think of these four types as steps on a ladder. Descriptive analytics is the starting point, and prescriptive analytics is the most advanced stage. Most companies begin with descriptive analytics and slowly move as their data maturity grows.
In fact, descriptive analytics still hold the largest share of the analytics market, at around 26 to 32 percent of total revenue. This shows that a large number of businesses are still at the early stage of their analytics journey. Now let us look at each type of business analytics in detail.
If you want to start your career in this field, you can join the Business Analytics Course by WsCube Tech, which includes practical training, internship, and placement support.
1. Descriptive Analytics: What Happened?
Descriptive analytics is the most basic and most widely used form of business analytics. It focuses on summarizing historical data to understand what has already taken place in a business. It does not try to explain causes or predict the future. It simply presents facts in an organized and readable way, usually through charts, graphs, dashboards, and reports.
For example, a monthly sales report that shows how many products were sold in each region is a form of descriptive analytics. It tells you the numbers, but not the reasons behind them.
How It Works
Descriptive analytics works by collecting raw data from different sources such as sales systems, websites, customer databases, or social media platforms. This data is then cleaned, organized, and summarized using basic statistical methods like averages, totals, percentages, and counts.
The process usually follows these steps:
- Data is collected from internal systems like CRM, ERP, or POS software
- The data is cleaned to remove errors, duplicates, or missing values
- Data is aggregated and summarized using simple formulas
- The results are displayed through dashboards, charts, or reports
The goal is to make raw numbers easy to read and understand, so that managers and teams can quickly see performance trends without needing to analyze anything themselves.
Tools Used (Tableau, Power BI, Qlik)
Some of the most popular tools for descriptive analytics include Tableau, Power BI, and Qlik. These tools are designed to turn spreadsheets full of numbers into visual dashboards that anyone can understand, even without a technical background.
- Tableau is known for its strong data visualization features and drag and drop interface, making it a favorite for building interactive dashboards.
- Power BI, developed by Microsoft, integrates well with Excel and other Microsoft products, which makes it a common choice for businesses already using Microsoft tools.
- Qlik stands out for its associative data model, which allows users to explore data freely instead of following a fixed path.
Real-World Example: Retail Sales Analysis
Imagine a retail company that operates 50 stores across India. At the end of each month, its management team wants to understand how the business performed. Using descriptive analytics, the company creates a dashboard that shows:
- Total sales: ₹8.5 crore in August
- Top-performing region: North India, with ₹3.2 crore in sales
- Best-selling product: Smartphones
- Highest-performing store: Jaipur store
- Monthly trend: Sales increased by 12% compared with July
This dashboard quickly tells managers what happened to the company's sales performance. However, it does not tell them why sales increased by 12% or why one region performed better than another. To answer those questions, the company would need to use diagnostic analytics.
2. Diagnostic Analytics: Why Did It Happen?
Once a business knows what happened, the next natural question is why it happened. This is where diagnostic analytics comes in. It goes a step beyond descriptive analytics by digging into the data to find the root cause of an event or trend.
Diagnostic analytics uses techniques like data mining, correlation analysis, and drill-down reporting to identify relationships between different variables. It helps businesses understand the cause and effect.
How It Works
Diagnostic analytics builds the summarized data from descriptive analytics but takes it further by breaking it down into smaller pieces. Analysts look for patterns, anomalies, and relationships between different factors that might explain a certain outcome.
Common techniques include:
- Drill-down analysis, where analysts zoom into specific segments of data
- Data discovery, which involves identifying patterns and outliers in datasets
- Correlation analysis, which checks if two variables move together
- Root cause analysis, which traces a problem back to its original source
For example, if descriptive analytics show that sales dropped in March, diagnostic analytics will explore factors like pricing changes, marketing spend, competitor activity, or seasonal demand to figure out the actual cause.
Tools Used (R, Python, SAS)
Diagnostic analytics usually require more advanced statistical tools compared to descriptive analytics. R, Python, and SAS are widely used for this purpose because they allow analysts to perform detailed statistical testing and build custom models.
- R is popular among statisticians for its strong data analysis and visualization of libraries.
- Python is widely used because of its simplicity and powerful libraries like Pandas and NumPy, which are useful for data manipulation and analysis.
- SAS is commonly used in large enterprises, especially in banking and healthcare, for advanced statistical analysis and reporting.
Real-World Example: Finding the Reason Behind a Sales Drop
Imagine the same retail company noticed through its descriptive analytics dashboard that sales fell by 15% in March, even though sales had been growing steadily for the previous three months. The management team now wants to know why sales dropped.
Using diagnostic analytics, analysts break down the March data and compare it with previous months. They examine:
- Store footfall: Customer visits dropped by 10%.
- Product prices: The company had increased prices on several popular products.
- Marketing campaigns: Advertising spending was 20% lower than in February.
- Competitor activity: A major competitor launched a 30% discount campaign during March.
After comparing these factors, analysts found that the biggest drop in customer visits occurred in areas where the competitor's discount campaign was running.
This helped the company identify a likely reason behind the 15% sales decline: customers were being attracted by the competitor's lower prices. While descriptive analytics showed what happened, diagnostic analytics helped the company understand why it happened.
Recommended Professional Certificates
Data Analytics Course with Gen AI
Data Science Course with Internship & Placement Support
3. Predictive Analytics: What Will Happen?
Predictive analytics takes historical data and uses it to forecast future outcomes. Instead of just looking backward, it looks forward to it. It uses statistical models, machine learning algorithms, and pattern recognition to estimate what is likely to happen next.
This type of analytics is widely used across industries because it helps businesses plan ahead instead of reacting after something has already happened.
How It Works
Predictive analytics works by training models on historical data to identify patterns that are likely to repeat. These models are then used to make predictions about future events, customer behavior, or business outcomes.
The general process includes:
- Collecting large volumes of historical data
- Cleaning and preparing the data for analysis
- Choosing the right statistical or machine learning model
- Training the model using past data
- Testing the model's accuracy
- Applying the model to predict future outcomes
Common techniques used in predictive analytics include regression analysis, time series forecasting, and machine learning algorithms like decision trees and neural networks.
Tools Used (Python, R, Cloud Platforms)
Predictive analytics uses programming languages and cloud platforms to build models, analyze data, and generate forecasts. Popular tools include:
- Python: Widely used for machine learning and predictive modelling with libraries like Scikit-learn and TensorFlow.
- R: Commonly used for statistical analysis and predictive modelling, with packages such as Caret and Forecast.
- AWS: Provides cloud-based machine learning and analytics services for building and deploying predictive models.
- Google Cloud: Offers scalable data processing and machine learning tools for large datasets.
- Microsoft Azure: Provides AI and machine learning services to develop, train, and deploy predictive models.
Real-World Example: Predicting Future Sales
Imagine the same retail company wants to prepare for the upcoming Diwali shopping season. Instead of guessing how much inventory to stock, the company uses predictive analytics.
Analysts feed the model with historical data such as:
- Sales from previous Diwali seasons
- Monthly sales trends
- Product demand
- Discounts and promotions
- Customer buying patterns
- Regional sales data
The model identifies patterns in the historical data and predicts that smartphone demand could increase by around 30% during the upcoming Diwali season, with the highest demand expected in northern and western regions. Based on this prediction, the company can stock more smartphones in those stores and adjust its marketing campaigns before the festive season begins.
Here, descriptive analytics tells the company what happened in the past, diagnostic analytics helps explain why it happened, and predictive analytics estimates what is likely to happen next.
4. Prescriptive Analytics: What Should We Do?
Prescriptive analytics is the most advanced type of business analytics. It does not just predict what might happen; it recommends the best possible action to take. It combines data, mathematical models, and optimization techniques to suggest specific decisions that lead to the best outcome.
This type of analytics answers the question every business leader ultimately cares about: what should we do next?
How It Works
Prescriptive analytics builds on predictive models but adds another layer, optimization. It considers multiple possible actions, weighs their outcomes against business goals and constraints, and recommends the option that delivers the best result.
The process typically involves:
- Using predictive models to forecast possible outcomes
- Applying optimization algorithms to test different scenarios
- Factoring in business constraints such as cost, time, or capacity
- Recommending the best course of action based on the analysis
Because it involves complex mathematical modeling, prescriptive analytics is usually the hardest type to implement and requires strong technical expertise.
Tools Used (Optimization Software: CPLEX, Gurobi)
Prescriptive analytics relies on specialized optimization software such as CPLEX and Gurobi. These tools use mathematical programming techniques to solve complex problems involving multiple variables and constraints, such as scheduling, routing, and resource allocation.
- CPLEX, developed by IBM, is widely used for linear and mixed integer programming problems.
- Gurobi is known for its speed and is commonly used in supply chain optimization, logistics planning, and financial modeling.
Real-World Example: Deciding How Much Inventory to Stock
Imagine the same retail company is preparing for the Diwali shopping season. Predictive analytics has already forecast that smartphone demand will increase by around 30%. Now, the company needs to decide how many smartphones to stock in each store. Using prescriptive analytics, the company considers factors such as:
- Expected demand in each location
- Current inventory levels
- Supplier capacity
- Storage space
- Product costs
- Delivery costs
- Risk of running out of stock
- Cost of keeping excess inventory
The optimization model compares thousands of possible inventory combinations and recommends how many smartphones each store should receive.
For example, it might recommend sending 5,000 units to high-demand stores, 3,000 units to medium-demand stores, and 1,500 units to lower-demand stores. The goal is to keep enough stock available to meet customer demand while avoiding unnecessary inventory costs. Here, predictive analytics tells the company what is likely to happen, while prescriptive analytics recommends what the company should do about it.
Upcoming Masterclass
Attend our live classes led by experienced and desiccated instructors of Wscube Tech.



One Business, Four Analytics Types: A Complete Walkthrough
To understand how all four types of business analytics work together, let us walk through a single business scenario from start to finish.
Imagine an online clothing brand that notices a sudden drop in sales during a particular month.
- Step 1: Descriptive Analytics – The company builds a dashboard using a tool like Power BI and finds that sales dropped by 20 percent in the last month compared to the previous one. This tells them what happened.
- Step 2: Diagnostic Analytics – The team then uses Python to dig deeper into the data. They find that cart abandonment rates increased sharply, and most of these abandoned carts came from mobile users. This tells them why it happened, a possible issue with the mobile checkout experience.
- Step 3: Predictive Analytics – Using historical data, the company builds a model to forecast how sales will trend over the next three months if the mobile checkout issue is not fixed. The prediction shows continued losses if the problem is left unresolved.
- Step 4: Prescriptive Analytics – Finally, using optimization tools, the company tests multiple solutions, such as redesigning the checkout page, offering limited-time discounts, or sending abandoned cart reminders. The analysis recommends redesigning the checkout process combined with reminder emails as the most effective and cost-efficient solution.
The four types of business analytics work together, moving businesses from understanding what happened to deciding what to do next. However, companies do not always use all four types. Simple problems may need only descriptive and diagnostic analytics, while recurring challenges such as demand forecasting and inventory planning often benefit from predictive and prescriptive analytics.
Descriptive vs. Diagnostic vs. Predictive vs. Prescriptive Analytics
Here you are going to know everything about all 4 types of business analytics. Get ready to understand the differences and then go ahead to make better decisions.
| Aspect | Descriptive Analytics | Diagnostic Analytics | Predictive Analytics | Prescriptive Analytics |
| Core Question | What happened? | Why did it happen? | What will happen? | What should we do? |
| Focus | Past data summary | Root cause discovery | Future forecasting | Best action recommendation |
| Complexity | Low | Medium | High | Very High |
| Common Tools | Tableau, Power BI, Qlik | R, Python, SAS | Python, R, Cloud Platforms | CPLEX, Gurobi |
| Output | Reports, dashboards | Correlations, explanations | Forecasts, probabilities | Recommended decisions |
| Example Use Case | Monthly sales report | Reason for sales drop | Demand forecasting | Inventory optimization |
Which Type of Analytics Should You Start With?
If you are new to business analytics, it is the best to start with descriptive analytics before moving toward more advanced types. This is because descriptive analytics builds a strong foundation in understanding data structures, reporting, and visualization, which are essential skills for every analytics role.
Here is a simple way to decide where to start based on your goal:
- If you want to understand reporting and dashboards, start with descriptive analytics using tools like Power BI or Tableau.
- If you enjoy investigating problems and finding patterns, move toward diagnostic analytics using Python or R.
- If you are interested in forecasting and machine learning, focus on predictive analytics.
- If you want to work on complex decision-making and optimization problems, aim for prescriptive analytics, which usually requires more experience.
Most professionals in this field do not master all four types at once. They usually build skills gradually, starting with descriptive and diagnostic analytics before moving toward predictive and prescriptive work.
If you are unsure whether this career path suits you, this video on, is a business analyst actually worth it breaks down the pros and cons in detail.
Read More Related Guides
Skills Needed for Each Type of Business Analytics
Each type of business analytics requires a slightly different skill set. Here is a breakdown of what you need to learn for each stage.
1. For Descriptive Analytics:
- Basic knowledge of Excel and spreadsheets
- Data visualization tools like Tableau or Power BI
- Understanding of basic statistics such as averages and percentages
- SQL for pulling data from databases
2. For Diagnostic Analytics:
- Strong understanding of statistics and correlation
- Programming skills in Python or R
- Data mining and pattern recognition techniques
- Ability to work with large and messy datasets
3. For Predictive Analytics:
- Machine learning fundamentals
- Knowledge of regression and time series forecasting
- Programming in Python or R with libraries like Scikit-learn
- Understanding of cloud platforms for handling large datasets
4. For Prescriptive Analytics:
- Strong mathematical and optimization skills
- Experience with tools like CPLEX or Gurobi
- Understanding of business operations and constraints
- Advanced knowledge of decision science and simulation modeling
If you want a structured path to learn these skills step by step, this business analyst roadmap video below explains the learning journey from beginner to advanced level.
Industries Using Each Type of Business Analytics
Business analytics is used across almost every major industry to turn data into better decisions. From tracking past performance to predicting future outcomes and recommending the best actions, organizations use descriptive, diagnostic, predictive, and prescriptive analytics for different business needs.
Banking, financial services, and insurance (BFSI) are among the largest users of business analytics, but industries such as retail, healthcare, manufacturing, and e-commerce also rely heavily on data-driven decision-making. Here is how the four types of analytics are applied across major industries.
1.Retail & E-commerce
Retailers and e-commerce companies generate large amounts of data from sales, customer searches, website visits, purchases, and inventory.
- Descriptive analytics: Tracks sales, revenue, website traffic, customer footfall, and product performance.
- Diagnostic analytics: Helps identify why a product is underperforming or why sales dropped in a particular region.
- Predictive analytics: Forecasts product demand, customer buying behavior, and seasonal sales trends.
- Prescriptive analytics: Recommends optimal pricing, inventory levels, promotions, and product recommendations.
Example: An e-commerce company can analyze previous festive-season sales to predict demand for popular products and adjust inventory before the season begins.
2. Healthcare
Healthcare organizations use analytics to improve patient care, manage resources, and identify potential risks.
- Descriptive analytics: Monitors patient admissions, treatment outcomes, hospital occupancy, and readmission rates.
- Diagnostic analytics: Helps determine why readmission rates increased or why certain treatments produce different outcomes.
- Predictive analytics: Identifies patients who may be at higher risk of complications and helps forecast demand for hospital resources.
- Prescriptive analytics: Recommends better staff schedules, resource allocation, and treatment approaches based on available data.
Example: A hospital can use predictive analytics to identify patients who may have a higher risk of readmission and provide additional follow-up care.
3. Banking & Finance
Banks and financial institutions deal with large volumes of transactions, customer, credit, and market data, making analytics essential for managing risk and improving financial decisions.
- Descriptive analytics: Tracks transaction volumes, account activity, revenue, and customer behavior.
- Diagnostic analytics: Investigates the reasons behind loan defaults, fraudulent transactions, or customer churn.
- Predictive analytics: Forecasts credit risk, fraud probability, customer churn, and potential loan defaults.
- Prescriptive analytics: Recommends suitable loan approval decisions, fraud prevention actions, and investment strategies.
Example: A bank can analyze a customer's financial history and other relevant data to predict the likelihood of loan default and make more informed lending decisions.
Common Challenges in Implementing Business Analytics
Even though business analytics offers huge value, many companies struggle to get real results from it. Understanding these challenges early can help you avoid common mistakes.
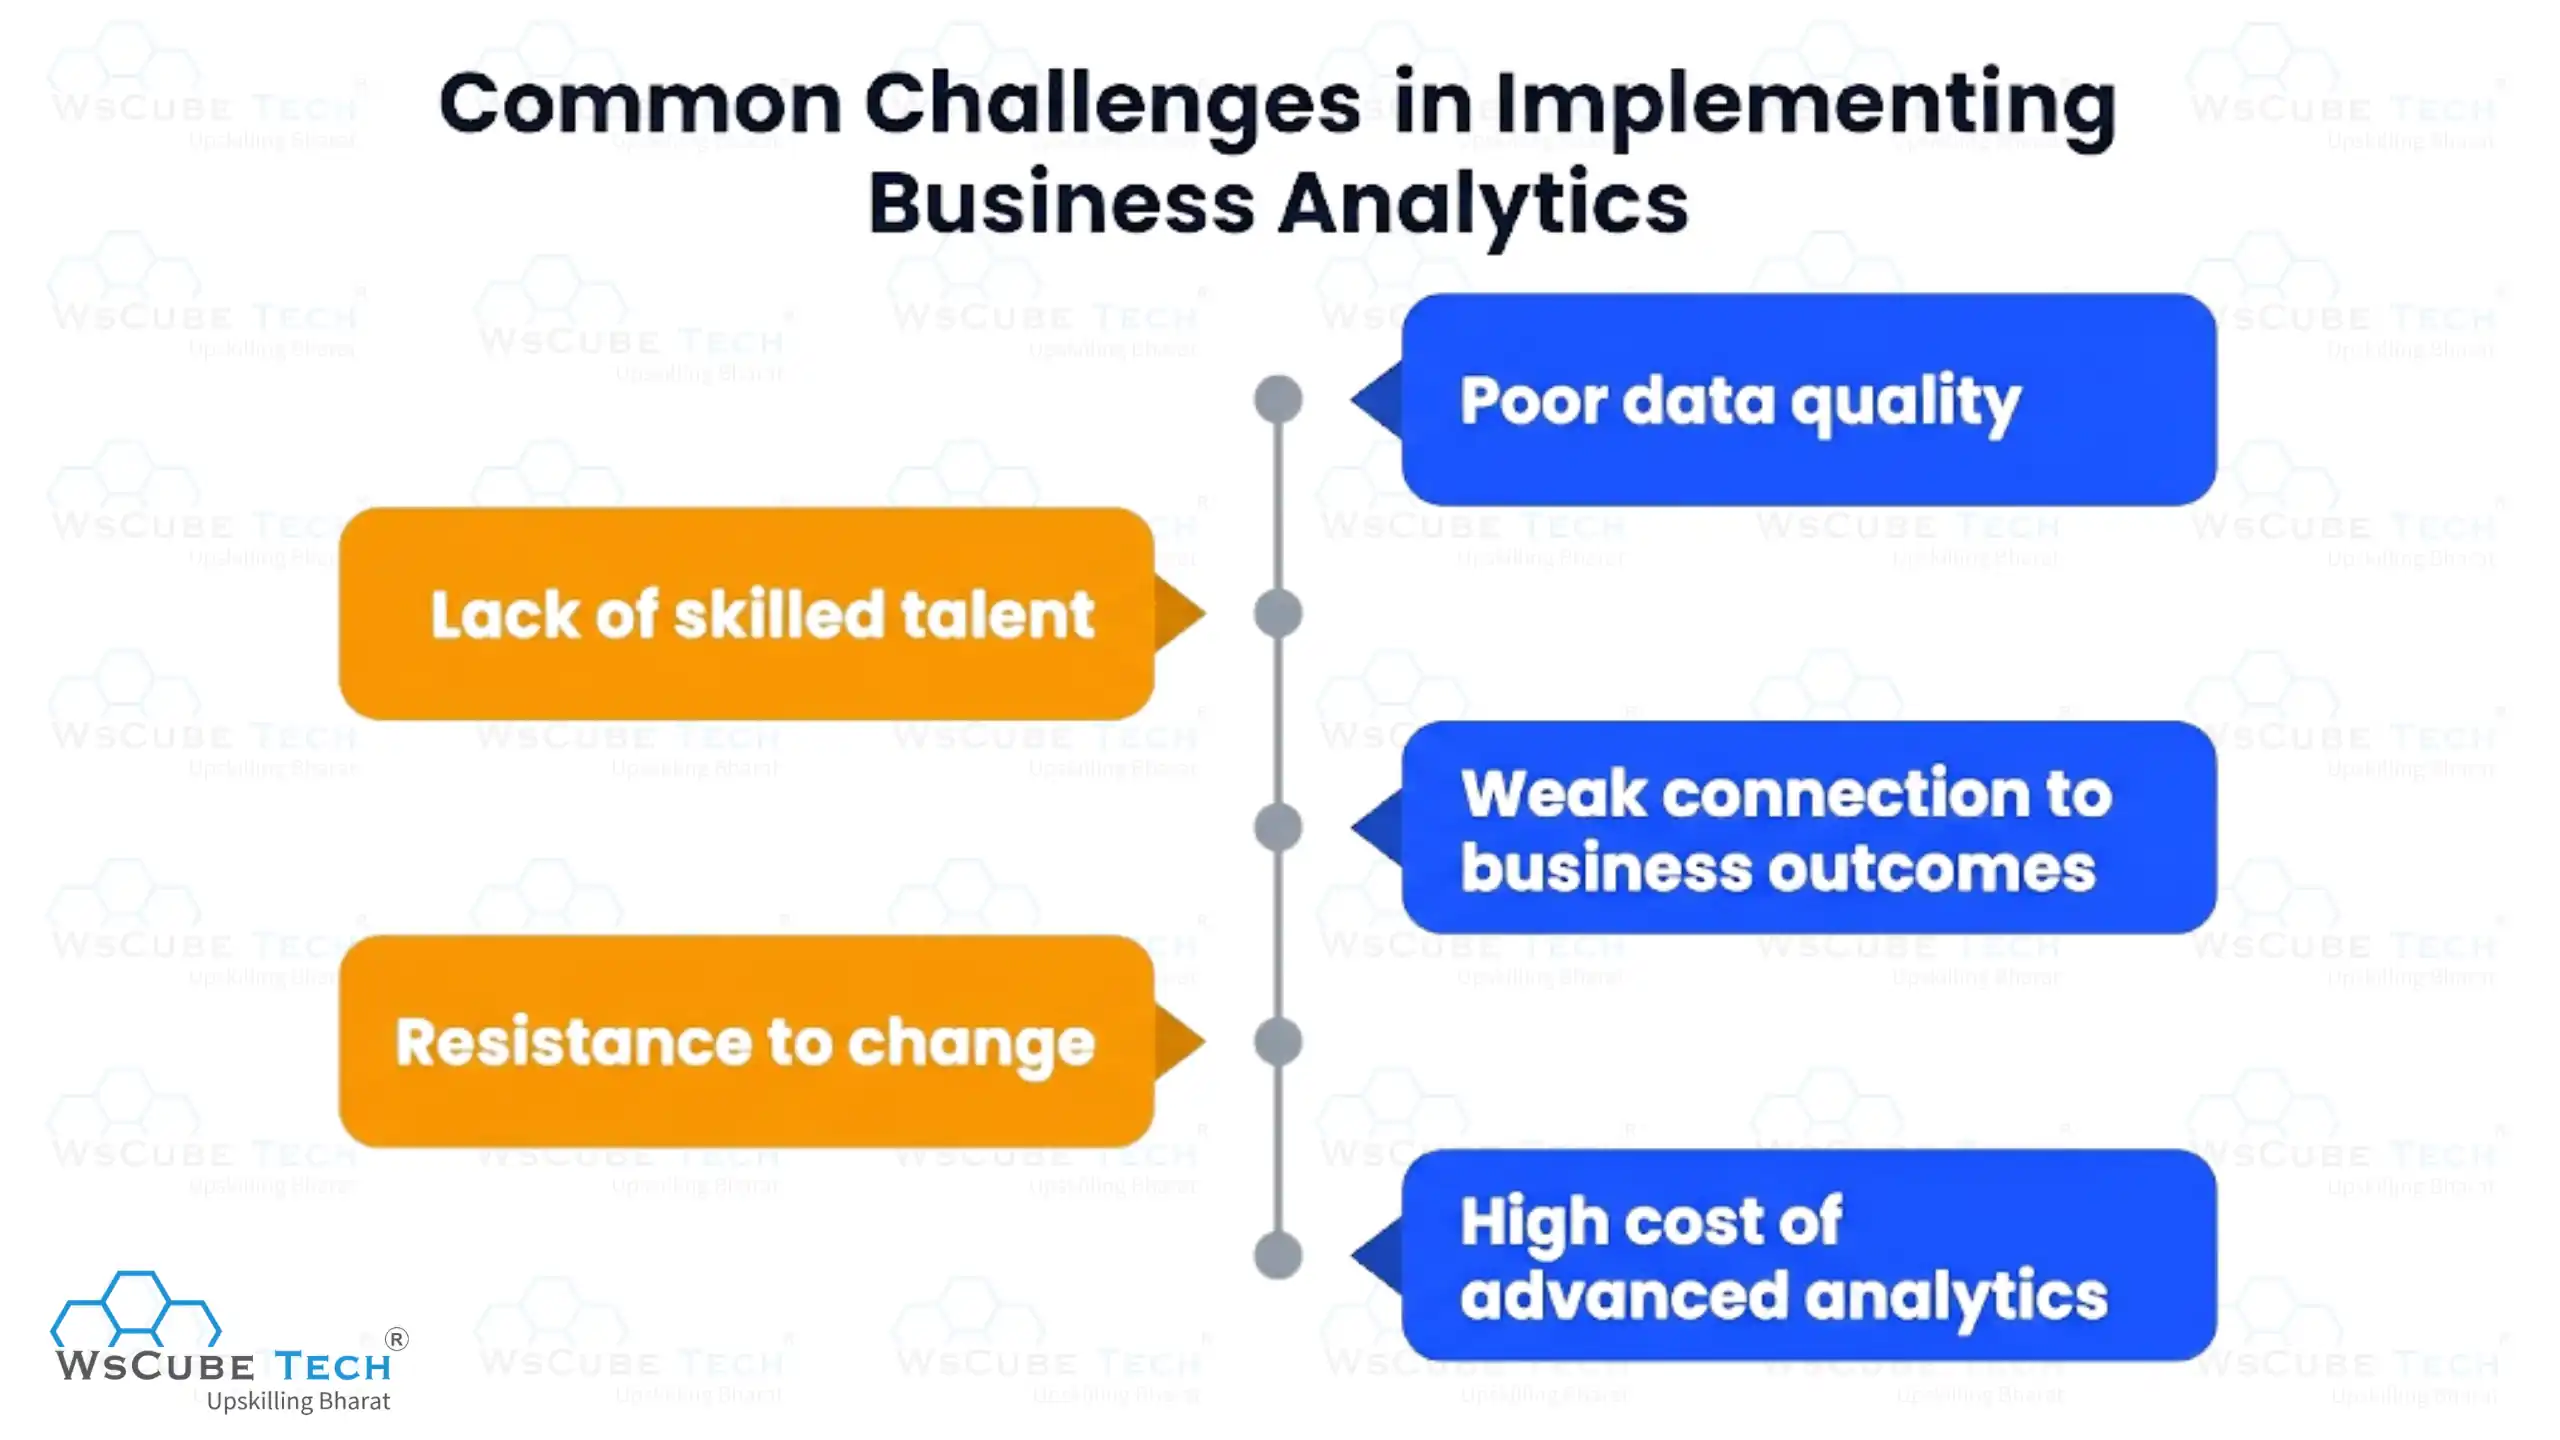
- Poor data quality: Analytics is only as good as the data behind it. If the underlying data has errors, duplicates, or missing values, even the most advanced predictive or prescriptive model will produce misleading results. This is often summed up as "garbage in, garbage out," and it remains one of the biggest hurdles for businesses adopting analytics.
- Lack of skilled talent: Diagnostic, predictive, and prescriptive analytics require people who understand statistics, programming, and business context together. Many companies find it hard to hire or train professionals who can bridge this gap.
- Weak connection to business outcomes: A large number of organizations struggle to connect their analytics work with actual business results. Some studies suggest that only around 11 percent of data leaders are able to directly link their analytics efforts to measurable business outcomes, while more than half do not formally track return on investment. This shows a real gap between collecting data and actually using it to drive decisions.
- Resistance to change: Even when insights are accurate, teams sometimes continue to rely on gut feelings instead of data. Building a culture where decisions are backed by analytics takes time, training, and support from leadership.
- High cost of advanced analytics: Prescriptive analytics requires specialized software and skilled talent, which can be expensive for smaller businesses. This is one reason large enterprises currently account for a bigger share of analytics spending compared to small and mid-sized companies, though smaller firms are catching up quickly as cloud-based tools become more affordable.
Despite these challenges, businesses that invest in fixing data quality issues, training their teams, and slowly moving from descriptive to prescriptive analytics tend to see stronger long-term results.
Explore Our Data Related Courses
| Online Data Analytics Course | Live Internship + 100% Job Support |
| Online Business Analytics Course | Live Internship + 100% Job Support |
| Online Data Science Course | Live Internship + 100% Job Support |
FAQs about Business Analytics Types
The four types are descriptive analytics, diagnostic analytics, predictive analytics, and prescriptive analytics. Together, they help businesses understand what happened, why it happened, what will happen, and what should be done next.
Descriptive analytics is generally considered the easiest starting point since it focuses on basic reporting and visualization using tools like Excel, Power BI, or Tableau.
Predictive analytics is currently in high demand across industries because businesses want to forecast trends and customer behavior. However, descriptive analytics still holds the largest overall market share since most companies begin their analytics journey there.
For descriptive analytics, coding is not always required since tools like Tableau and Power BI are mostly visual. However, diagnostic, predictive, and prescriptive analytics usually require programming skills in Python or R.
Yes, but it takes time. Most beginners start with descriptive analytics, then move toward diagnostic and predictive analytics, and finally build expertise in prescriptive analytics as they gain more experience.
Predictive analytics forecasts what is likely to happen in the future, while prescriptive analytics goes a step further and recommends the specific action a business should take based on that forecast.
Banking, financial services, insurance, healthcare, and retail are among the biggest users of business analytics, though nearly every industry today applies some form of data analysis to improve decision-making.
Common tools include Tableau, Power BI, and Qlik for descriptive analytics, Python, R, and SAS for diagnostic and predictive analytics, and optimization software like CPLEX and Gurobi for prescriptive analytics.
Yes, business analytics is a growing field with strong demand across industries. As companies continue to generate more data, the need for skilled analytics professionals continues to rise.
Business analytics focuses more on using data to guide business decisions, often through reporting, forecasting, and optimization. Data science tends to focus more on building complex algorithms and models, though the two fields overlap significantly in practice.
Explore Our Free Tech Tutorials
| Python Tutorial | Java Tutorial | JavaScript Tutorial |
| C Tutorial | C++ Tutorial | HTML Tutorial |
| CSS Tutorial | SQL Tutorial | DSA Tutorial |
Practice Coding With Our Free Compilers
| Online Python Compiler | Online HTML Compiler | Online C Compiler |
| Online C++ Compiler | Online JS Compiler | Online Java Compiler |
Join Our On-Campus Data Analytics Program
Join Our On-Campus Data Science Program
Explore Our Free Courses


Leave a comment
Your email address will not be published. Required fields are marked *Comments (0)
No comments yet.