
Data analytics has become one of the most valuable skills in today’s data-driven world. Businesses, organizations, and even governments rely on data to make smarter decisions and improve their services. From understanding customer behavior to predicting market trends, data analytics helps turn raw information into meaningful insights. As a result, many students and professionals are now interested in building a career in this growing field.
If you are wondering how to learn data analytics, the good news is that it is easier to start than ever before. With the right learning path, tools, and consistent practice, anyone can develop strong analytical skills. By learning step by step and working on real-world examples, beginners can gradually build the knowledge needed to succeed in the field of data analytics.
What is Data Analytics?
Data analytics is the process of examining raw data to find useful insights, patterns, and trends. It involves collecting, organizing, and analyzing data so that meaningful information can be extracted. These insights help organizations understand their data and make better decisions.
Data analytics is used in many industries such as healthcare, finance, marketing, education, and e-commerce. By analyzing data, companies can understand customer behavior, improve their strategies, and make more accurate business decisions.
Types of Data Analytics
Data analytics types are mainly divided into four categories. Each type focuses on answering different kinds of questions about data.
1. Descriptive Analytics
Descriptive analytics focuses on understanding what has already happened in the past. It analyzes historical data and presents it in the form of reports, dashboards, and summaries. Businesses often use descriptive analytics to track performance and identify trends.
2. Diagnostic Analytics
Diagnostic analytics helps explain why something happened. It examines data more deeply to identify the reasons behind certain outcomes or trends. Techniques such as data comparison and correlation analysis are commonly used here.
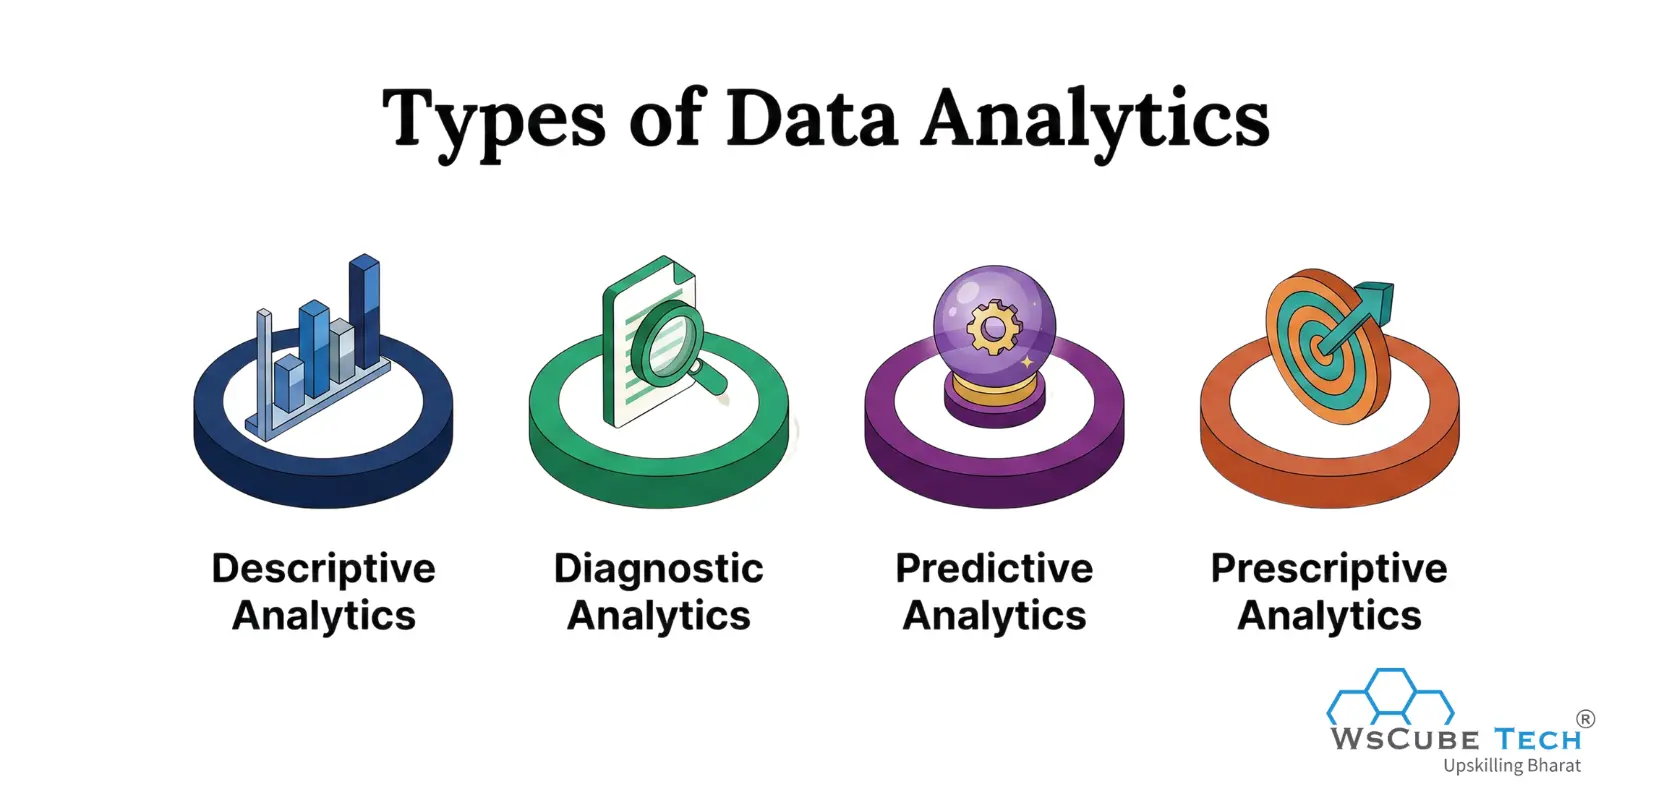
3. Predictive Analytics
Predictive analytics focuses on forecasting future outcomes based on historical data. It uses statistical models, machine learning, and data patterns to make predictions. For example, companies may predict customer demand, sales growth, or potential risks.
4. Prescriptive Analytics
Prescriptive analytics suggests the best possible actions based on data analysis. It not only predicts future outcomes but also recommends solutions or strategies to achieve better results. Businesses use prescriptive analytics to improve decision-making and optimize processes.
Also Read: What is Data Analytics? A Beginner’s Guide
Why Learn Data Analytics?
Learning data analytics helps individuals understand data, make better decisions, and discover useful insights. It is a valuable skill that opens many career opportunities in today’s technology-driven world. Below are the key reasons:
- High Demand Career: Data analytics professionals are in high demand across industries such as finance, healthcare, marketing, and technology. Organizations rely on data insights to understand trends, improve strategies, and make smarter business decisions in a competitive market.
- Better Decision Making: Data analytics helps businesses and organizations make informed decisions by analyzing real data, identifying patterns, and understanding trends instead of relying on assumptions.
- Good Salary Opportunities: Professionals with data analytics skills often receive competitive salaries because companies value experts who can analyze data and provide insights that support business growth.
- Wide Industry Applications: Data analytics is useful in many industries, including healthcare, finance, marketing, education, and e-commerce, making it a versatile skill for various career paths.
- Improves Problem-Solving Skills: Learning data analytics strengthens analytical thinking and problem-solving abilities by helping individuals examine data, identify issues, and develop effective data-driven solutions.
Skills Required to Learn Data Analytics
To learn data analytics effectively, you need a combination of technical knowledge and data analytics skills. These skills help you understand data, analyze patterns, and generate meaningful insights. Below are the key skills required:
- Analytical Thinking: Analytical thinking helps you understand data patterns and relationships. It allows you to break complex problems into smaller parts, interpret data correctly, and draw meaningful conclusions from the analysis.
- Basic Mathematics and Statistics: Understanding basic mathematics and statistics helps analysts work with numbers and interpret data correctly. Concepts such as averages, percentages, probability, and distributions help identify patterns and draw meaningful conclusions from data.
- Programming Skills: Programming languages such as Python and R are commonly used in data analytics. They help analysts clean data, perform calculations, build models, and automate data analysis tasks efficiently.
- Data Visualization: Presenting complex data in visual formats such as charts, graphs, and dashboards makes information easier to understand. It helps analysts clearly communicate insights, patterns, and trends so others can quickly interpret the results.
- Knowledge of SQL: SQL helps analysts work with databases and retrieve required information from large datasets. It allows users to filter, sort, and manage data efficiently for analysis and reporting.
- Problem-Solving Skills: These skills help analysts identify issues in data and find effective solutions. By analyzing information carefully, they can discover insights and support better data-driven decisions.
Recommended Professional Certificates
Data Analytics Course with Gen AI
Data Science Course with Internship & Placement Support
Step-by-Step Roadmap to Learn Data Analytics
Here is a simple data analytics roadmap you can follow to start learning data analytics step by step. By following these steps, you can build the knowledge and practical skills required in this field.
Step 1: Learn the Basics of Data Analytics
The first step is to understand the basic concepts of data analytics. Learn how data is collected, cleaned, analyzed, and interpreted to generate useful insights. It is also important to understand the different types of data analytics, basic statistics, and how data supports better decision-making. This foundation will make it easier to learn advanced tools and techniques later.
Step 2: Learn Excel for Data Analysis
Excel is one of the most widely used tools for data analysis. It helps you organize, clean, and analyze data efficiently. By learning Excel features such as formulas, pivot tables, charts, and data filtering, you can quickly summarize large datasets and identify important patterns or trends. Many beginners start their data analytics journey with Excel because it is simple to use and widely used in businesses.
Step 3: Learn SQL for Data Handling
SQL is an important skill for working with databases in data analytics. It helps you retrieve, filter, and manage data stored in large datasets. By learning SQL commands such as SELECT, WHERE, JOIN, GROUP BY, and ORDER BY, you can easily query databases and extract the information needed for analysis. SQL is widely used by data analysts to handle and organize structured data efficiently.
Step 4: Learn a Programming Language (Python or R)
Learning a programming language like Python or R helps you analyze data more efficiently and handle complex tasks. These languages allow you to clean data, perform analysis, and build models for better insights.
- Python: It is widely used in data analytics due to its simplicity and powerful libraries such as Pandas, NumPy, and Matplotlib. It is beginner-friendly and suitable for data analysis, automation, and machine learning tasks.
- R: R is mainly used for statistical analysis and data visualization. It provides strong support for data modeling and is popular among statisticians and researchers for analyzing complex datasets.
Both Python and R are valuable in data analytics, and choosing one depends on your goals. You can start with Python for simplicity and later explore R for advanced statistical analysis.
Step 5: Learn Data Visualization Tools
Data visualization tools help analysts present data in a clear and easy-to-understand format. Instead of showing raw numbers, these tools convert data into charts, graphs, and dashboards that highlight important insights and patterns. Tools such as Tableau and Power BI are widely used to create interactive visual reports, helping businesses and teams understand data quickly and make better decisions.
Step 6: Work with Real Datasets and Projects
Working with real datasets helps you apply theoretical knowledge in practical situations. By building projects, you gain hands-on experience, improve problem-solving skills, and understand real-world data challenges. This step also helps you create a strong portfolio, which is important for getting jobs in data analytics.
Upcoming Masterclass
Attend our live classes led by experienced and desiccated instructors of Wscube Tech.


Important Tools Used in Data Analytics
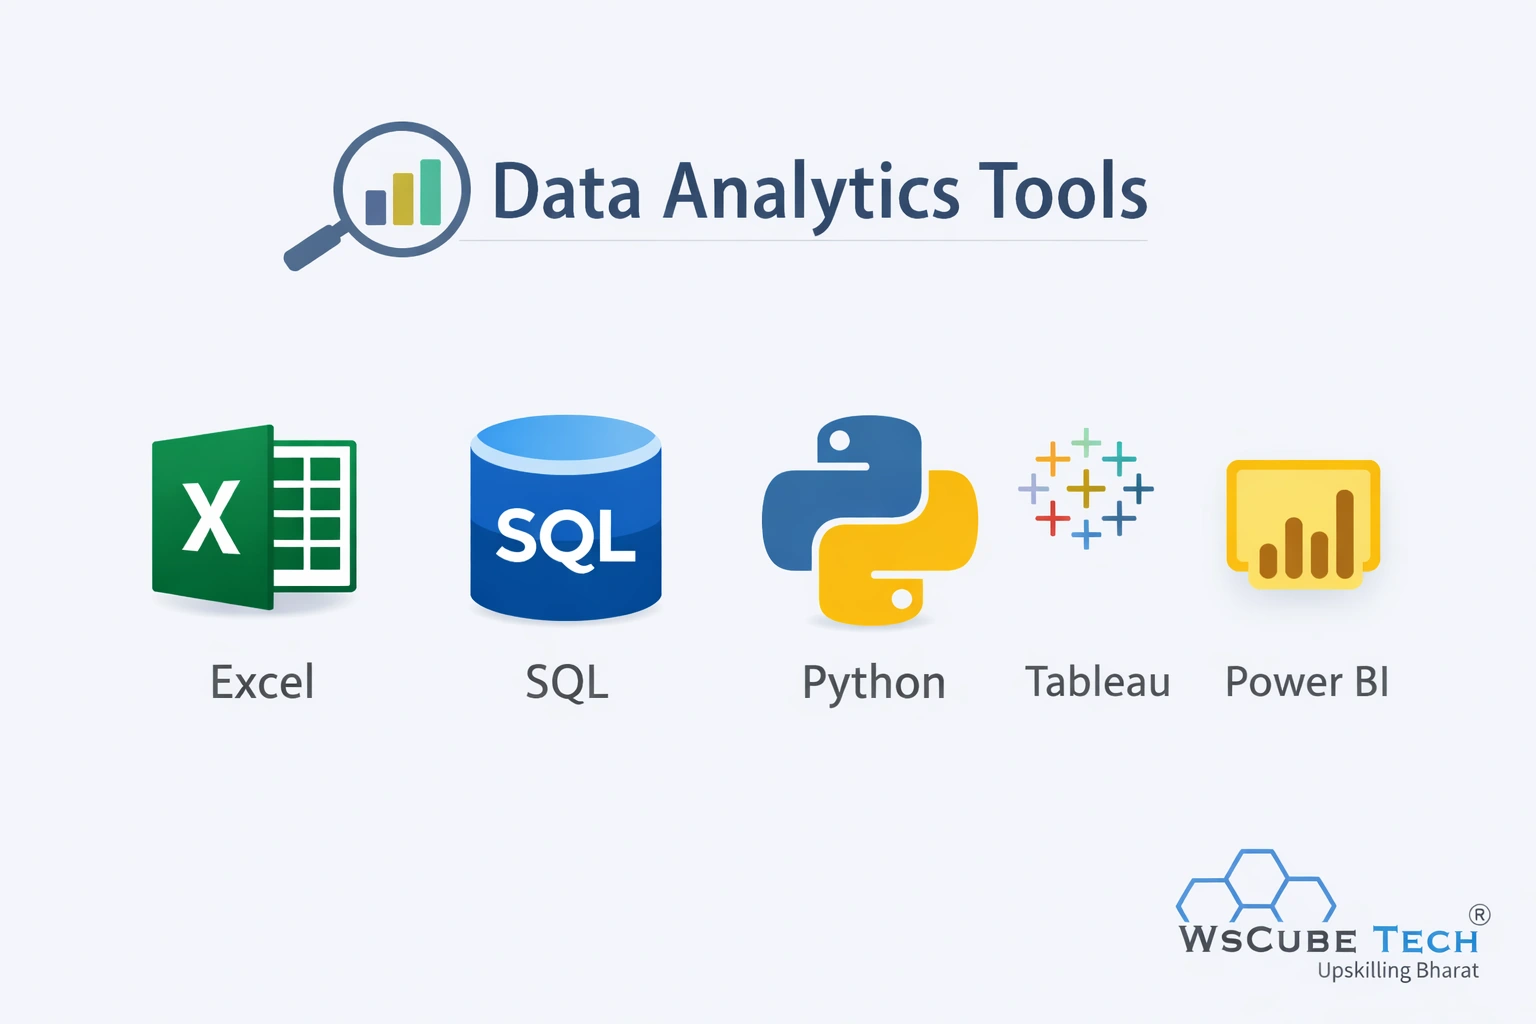
Below are the tools used in data analytics to collect, process, analyze, and visualize data effectively:
| Tool Name | Category | Purpose |
| Excel | Spreadsheet Tool | Used for basic data analysis, calculations, and data visualization |
| SQL | Database Query Language | Used to store, retrieve, and manage data from databases |
| Python | Programming Language | Used for data analysis, automation, and machine learning |
| R | Programming Language | Used for statistical analysis and data visualization |
| Power BI | Visualization Tool | Used to create interactive dashboards and reports |
| Tableau | Visualization Tool | Used for advanced data visualization and business intelligence |
| Google Sheets | Spreadsheet Tool | Used for online data management and collaboration |
Best Resource to Learn Data Analytics
If you want to learn data analytics in a structured and practical way, WsCube Tech’s online data analytics course is a great option. This program is designed for beginners and covers everything from basic concepts to advanced tools with real-world projects, helping you become job-ready with proper guidance and hands-on experience.
Books to Learn Data Analytics
1. Data Analytics Made Accessible – Anil Maheshwari
This book explains data analytics concepts in a simple and easy-to-understand way, making it suitable for beginners.
2. Python for Data Analysis – Wes McKinney
A great book for learning how to analyze data using Python, including libraries like Pandas and NumPy.
3. Data Science for Business – Foster Provost & Tom Fawcett
This book helps readers understand how data analytics and data science are used to make better business decisions.
4. Practical Statistics for Data Scientists – Peter Bruce & Andrew Bruce
A useful book that explains statistical concepts required for data analysis with practical examples.
Beginner Projects for Data Analytics Practice
Practicing with real projects is one of the best ways to improve your data analytics skills. Working on projects helps you understand how to collect, clean, analyze, and visualize data while solving real-world problems. It also helps you build a strong portfolio that can showcase your skills to employers.
If you are looking for ideas to start practicing, you can explore our 20+ Data Analytics Projects. These projects will help you apply different tools such as Excel, SQL, Python, and data visualization to analyze real datasets and gain practical experience in data analytics.
Read More Data Guides
Common Mistakes to Avoid While Learning Data Analytics
Below are some mistakes that you can avoid during your data analytics learning journey to improve your understanding and build strong practical skills effectively.
- Skipping the Basics: Many beginners jump directly to advanced tools without understanding fundamentals like data types, statistics, and analysis processes, which leads to confusion and weak foundation in data analytics.
- Ignoring Data Cleaning: Data cleaning is a crucial step, but beginners often ignore it. Working with unclean data can produce incorrect results and affect the accuracy and reliability of analysis outcomes.
- Focusing Only on Theory: Learning only theoretical concepts without practical implementation limits your growth. Without hands-on practice, it becomes difficult to understand how data analytics works in real-world scenarios.
- Not Practicing with Real Projects: Avoiding real-world projects can slow down your learning progress in data analytics. Working on projects helps you apply the concepts you learn, understand how data analysis works in practical situations, strengthen problem-solving abilities, and build a strong portfolio that demonstrates your skills and practical experience.
- Learning Too Many Tools at Once: Trying to learn multiple tools simultaneously can create confusion. It is better to focus on one tool at a time and build a strong understanding before moving to another.
- Ignoring Data Visualization: Many learners underestimate the importance of visualization. Without proper charts and graphs, it becomes difficult to communicate insights clearly and effectively to others.
Also Read: Data Analyst vs. Data Scientist: Key Differences & Comparison
How Long Does It Take to Learn Data Analytics?
The time required to learn data analytics depends on your background, learning pace, and the time you dedicate to practice. For beginners, it usually takes 3 to 6 months to learn the basic concepts and commonly used tools such as Excel, SQL, basic statistics, and data visualization.
If you want to develop more advanced skills and work with tools like Python, R, or Power BI, it may take around 6 to 12 months of consistent learning and practice. During this period, working on real datasets and building projects helps you understand how data analytics is applied in practical situations.
The most important factors for learning data analytics faster are regular practice, hands-on projects, and continuous learning. With dedication and the right resources, you can build strong and practical data analytics skills within a reasonable time.
Career Opportunities in Data Analytics
Below are career opportunities in data analytics that you can explore after developing the required skills and practical experience in this growing field.
- Data Analyst: A data analyst collects, cleans, and analyzes data to identify patterns and insights. They create reports and dashboards to help organizations make informed business decisions effectively.
- Business Analyst: A business analyst uses data to understand business performance and identify improvement opportunities. They analyze processes, study trends, and recommend strategies to improve efficiency and support better decision-making within the organization.
- Data Scientist: A data scientist analyzes large datasets using advanced tools, statistics, and machine learning techniques to discover insights, build predictive models, and solve complex data-driven problems.
- Data Engineer: A data engineer develops and manages systems that handle data flow and storage. They make sure data is collected, organized, and available in a reliable way for analysts and scientists to use for analysis and insights.
- Marketing Analyst: A marketing analyst studies marketing data to understand customer behavior, campaign performance, and market trends. Their insights help companies improve marketing strategies and increase business growth.
Also Read: Types of Data Analytics (All 4 Types Explained)
Salary for a Data Analyst
Below are the average salaries of data analysts in India based on experience, skills, and job roles across different levels:
| Experience Level | Average Salary (₹ LPA) | Monthly Salary (Approx.) | Description |
| Fresher (0–1 Years) | ₹3 – ₹6 LPA | ₹25,000 – ₹40,000 | Entry-level roles with basic skills like Excel, SQL |
| Junior (1–3 Years) | ₹5 – ₹8 LPA | ₹40,000 – ₹65,000 | Handles data cleaning, reporting, and analysis |
| Mid-Level (3–5 Years) | ₹6 – ₹12 LPA | ₹50,000 – ₹1,00,000 | Works on dashboards, insights, and automation |
| Senior (5+ Years) | ₹12 – ₹20+ LPA | ₹1,00,000 – ₹1,50,000+ | Handles advanced analysis and decision-making |
| Lead / Manager (10+ Years) | ₹18 – ₹25+ LPA | ₹1,50,000 – ₹2,00,000+ | Leads teams and manages business strategies |
Note: Salaries may vary based on skills, company, location, and experience.
How To Become a Data Analyst? Video Guide
FAQs About How to Learn Data Analytics
Data analytics is the process of examining raw data to discover useful patterns, trends, and insights. It helps businesses make better decisions, improve performance, and understand customer behavior effectively.
To learn data analytics, you need analytical thinking, basic statistics knowledge, data cleaning skills, data visualization, and problem-solving ability, along with tools like Excel, SQL, Python, and visualization platforms.
Start by understanding basic concepts of data analytics and statistics. Then learn tools like Excel and SQL for data handling and analysis. After that, move to Python or R for advanced analysis and practice regularly with real-world projects to build strong practical skills.
Yes, beginners can learn data analytics easily with proper guidance and consistent practice. Starting with basics and gradually learning tools and projects helps build a strong foundation in data analytics.
It usually takes around 3–6 months to learn the basics of data analytics and 6–12 months to become job-ready, depending on your learning consistency, practice, and project experience.
Coding is not strictly required for beginners, but learning programming languages like Python or R helps perform advanced data analysis, automate tasks, and handle large datasets efficiently.
Python is the most popular choice due to its simplicity, powerful libraries, and wide use in the industry. R is also useful, especially for statistical analysis and data visualization tasks.
Some of the best tools include Excel, SQL, Python, R, Power BI, Tableau, and Google Sheets. These tools help in data analysis, visualization, reporting, and efficient data handling.
Career opportunities include roles like data analyst, business analyst, data scientist, product analyst, and data engineer, where professionals analyze data, generate insights, and support business decision-making processes.
Yes, data analytics is a great career option in 2026 due to high demand, competitive salaries, and increasing reliance on data-driven decisions across industries like finance, healthcare, and technology.
The average salary for a data analyst in India is around ₹6,52,597 per year. It may vary based on experience, skills, location, and the company you work for.

Conclusion
Learning data analytics is a valuable step toward building a strong and future-ready career. By following a structured roadmap, learning the right tools, and practicing with real projects, you can develop the skills required to work with data effectively.
With growing demand across industries, data analytics offers excellent career opportunities, competitive salaries, and long-term growth. Start your learning journey today, stay consistent, and focus on practical experience to succeed in this field.
Join Our On-Campus Data Analytics Course


Leave a comment
Your email address will not be published. Required fields are marked *Comments (0)
No comments yet.