Data is everywhere today. From online shopping and social media to banking and healthcare, every action creates useful information. Companies use this data to understand customers, improve services, and make better decisions. For example, Flipkart studies what people search and buy to recommend products and increase sales.
Because of this, data analytics has become one of the most important skills in today’s digital world. Businesses use data to predict trends, solve problems, and improve performance.
Due to high demand, data analytics is now a popular and well-paying career choice.
In this guide, you will learn the basic concepts, process, tools, techniques, career options, and future scope of data analytics in a simple way.
What is Data Analytics? (Definition)
Data analytics means examining raw data to identify useful patterns, trends, and insights that help in better decision-making. It involves collecting, organizing, and analyzing data using different tools and techniques. Businesses, organizations, and even governments use data analytics to understand performance, customer behavior, and market changes.
By analyzing data carefully, companies can reduce risks, improve efficiency, and plan future strategies with confidence. Today, data analytics is widely used in industries like finance, healthcare, retail, education, and technology to gain a competitive advantage and achieve growth.
Why is Data Analytics Important?
Data analytics plays a major role in helping businesses and organizations make better decisions based on facts instead of guesswork. It helps identify trends, improve performance, understand customers, and increase profits. Companies use data to solve problems, reduce risks, and plan future strategies effectively. Below is the importance of data in analytics you can understand clearly:
- Better Decision Making: Helps you make accurate and informed business decisions using real data instead of assumptions.
- Improved Customer Understanding: Allows you to analyze customer behavior, preferences, and needs to provide better products and services.
- Increased Efficiency: Identifies areas where processes can be improved, saving time, money, and resources.
- Risk Management: Helps detect potential risks and take preventive actions before problems grow bigger.
- Competitive Advantage: Gives you insights that help your business stay ahead of competitors in the market.
Also Read: Is Data Analyst A Good Career? Beginner’s Guide
Types of Data Analytics
Data analytics can be divided into different types based on how organizations use data to understand past performance, identify problems, predict future outcomes, and make better decisions. Each type helps in transforming raw data into meaningful insights for business growth and improvement. Below are the different types of data analytics:
1. Descriptive Analytics
Descriptive analytics answers the question “What happened?” by analyzing historical data to summarize past performance. It uses reports, dashboards, and visualization tools to present data in a meaningful way, helping organizations identify trends, patterns, and overall business results over time.
2. Diagnostic Analytics
Diagnostic analytics focuses on analyzing past data to determine the reasons behind specific outcomes or trends. It uses techniques like data comparison, correlation, and drill-down analysis to identify patterns and relationships, helping organizations understand problems more clearly as it answers the question “Why did it happen?” for better decision-making.
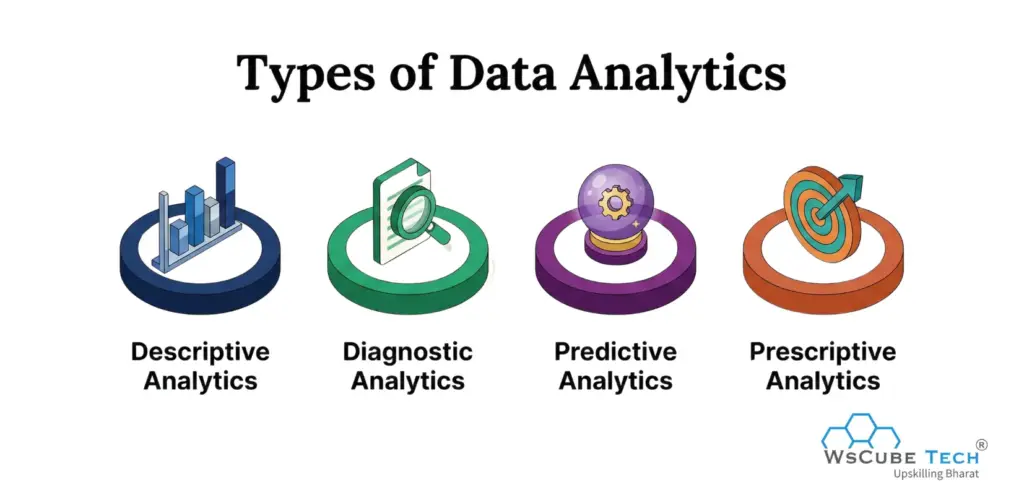
3. Predictive Analytics
Predictive analytics helps forecast future outcomes using historical and current data. It answers the question “What is likely to happen?” by analyzing patterns, trends, and relationships within data through statistical models and machine learning techniques. This approach enables organizations to estimate future risks, opportunities, and performance results with greater accuracy.
Businesses use predictive analytics for sales forecasting, customer behavior analysis, risk assessment, and demand planning, allowing them to make proactive and well-informed decisions.
4. Prescriptive Analytics
Prescriptive analytics helps recommend the best course of action for future situations using available data. It answers the question “What should be done?” by analyzing possible outcomes through advanced techniques such as optimization and simulation, enabling organizations to make effective decisions and improve overall business performance.
Recommended Professional Certificates
Data Analytics Course with Gen AI
Data Science Course with Internship & Placement Support
Data Analytics Process (Step-by-Step)
The data analytics process involves a series of structured steps that help organizations collect, organize, and analyze data to extract meaningful insights. By following a proper step-by-step approach, businesses can convert raw data into useful information that supports smarter decision-making and improves overall performance.
Below is the step-by-step Data Analytics Process:
1. Data Collection
Data collection is the first step in the data analytics process, where relevant information is gathered from sources such as databases, online platforms, surveys, and internal systems. Collecting accurate, complete, and relevant data is essential because the quality of insights depends on the reliability of the data collected.
2. Data Cleaning
Data cleaning is the process of removing errors, duplicate entries, and missing or irrelevant information from the collected data. This step helps improve data quality by ensuring that the dataset is accurate, consistent, and ready for analysis to produce reliable and meaningful results.
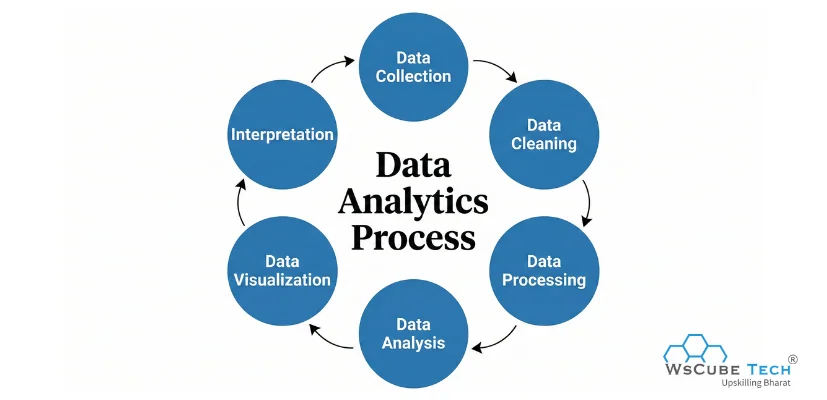
3. Data Processing
Data processing involves organizing and converting the cleaned data into a suitable format for analysis. This step includes sorting, filtering, and structuring the data to make it easier to analyze, helping improve accuracy and ensure better results in the next stages of the data analytics process.
4. Data Analysis
Data analysis involves reviewing and evaluating processed data to uncover trends, patterns, and valuable insights. It includes using various analytical methods and tools to understand the data clearly, allowing organizations to draw conclusions and make better decisions based on the findings.
5. Data Visualization
Data visualization involves presenting analyzed data in graphical formats such as charts, graphs, and dashboards. It helps simplify complex data and makes it easier to understand patterns, trends, and insights.
By using visual elements, organizations can quickly interpret information and communicate findings clearly, supporting better decision-making and improving overall business performance.
6. Interpretation and Decision-Making
Interpretation and decision-making involve understanding the results obtained from data analysis and drawing meaningful conclusions. This step helps organizations use insights to make informed decisions, solve problems effectively, and plan strategies that support business growth and improved performance.
Data Analytics Techniques
Data analytics techniques are methods used to examine data and extract useful insights that support decision-making. These techniques help organizations understand patterns, identify trends, and solve business problems by analyzing data effectively.
Below are the commonly used Data Analytics Techniques:
1. Regression Analysis
Regression analysis is a technique used to study how different variables are related within a dataset. It evaluates how changes in one factor affect another, helping identify trends and estimate future outcomes. Organizations use this method to improve planning and make informed decisions based on historical data.
2. Time Series Analysis
Time series analysis is used to examine data collected at regular time intervals. It helps identify trends, seasonal patterns, and fluctuations over time. This method is commonly used for stock market analysis, sales forecasting, demand prediction, and performance tracking to support better planning and future decision-making.
3. Sentiment Analysis
Sentiment analysis is used to determine the emotions or opinions expressed in text data. It helps organizations understand customer feedback, reviews, and social media responses to improve products, services, and overall customer satisfaction.
4. Cluster Analysis
This technique is used to group data points into categories based on shared characteristics. It helps identify patterns within large datasets, allowing organizations to understand customer behavior, segment data effectively, and make better decisions for targeted strategies and improved business outcomes.
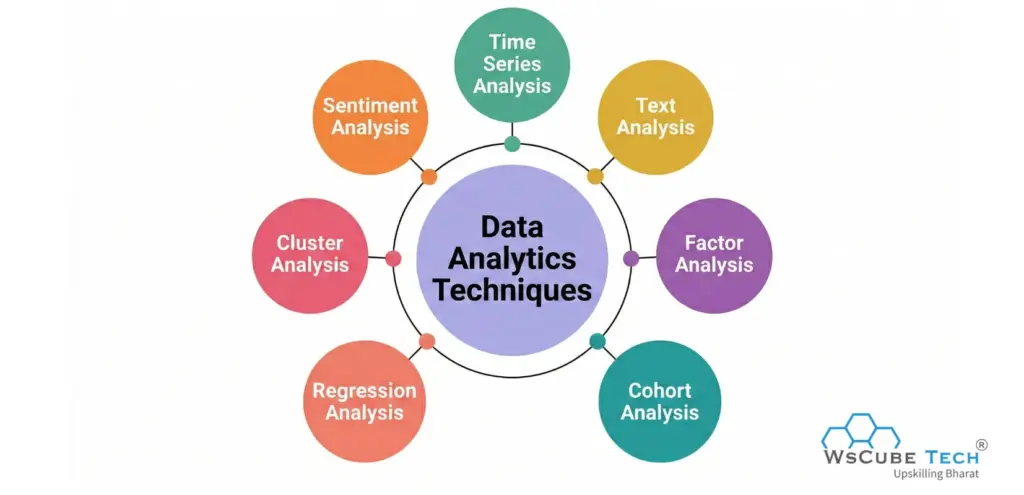
5. Text Analysis
Text analysis is used to examine unstructured text data such as emails, reviews, and documents. It helps extract meaningful information, identify patterns, and understand customer opinions for better decision-making.
6. Factor Analysis
Factor analysis is a statistical method used to reduce a large number of variables into smaller, meaningful factors. It helps identify underlying relationships within data, simplify complex datasets, and improve interpretation for research, surveys, and business analysis purposes.
7. Cohort Analysis
Cohort analysis is a technique used to examine the behavior of a specific group of users who share a common characteristic within a defined time period. It helps track engagement, retention, and performance patterns over time. Businesses use cohort analysis to understand customer lifecycle trends, measure long-term growth, and improve marketing or product strategies.
Upcoming Masterclass
Attend our live classes led by experienced and desiccated instructors of Wscube Tech.

Tools Used in Data Analytics
Various software and platforms are used to collect, process, analyze, and visualize data efficiently. These tools in data analytics help organizations manage large datasets, identify patterns, and generate meaningful insights for better decision-making and business growth.

| Tool | Description |
| Excel | Used for basic data analysis, cleaning data, organizing datasets, performing calculations, and creating charts or reports. |
| SQL | Used to manage and query structured data stored in databases for efficient data retrieval and analysis. |
| Python | Used for data analysis, automation, and machine learning tasks. |
| R | A programming language mainly used for statistical analysis, data modeling, and visualization. |
| Power BI | Helps create interactive dashboards and visual reports for analyzing business data. |
| Tableau | A visualization tool used to create dynamic dashboards and transform complex data into easy-to-understand visuals. |
| SAS | Used for advanced analytics and data management to perform statistical analysis tasks. |
| Google Analytics | Used to track website traffic and analyze user behavior to improve marketing performance and strategy. |
Pro Tip: Focus on learning one tool at a time, apply your knowledge in projects, and gradually improve your problem-solving and analytical thinking skills.
Applications of Data Analytics
Data analytics is used across industries to improve decision-making, optimize operations, and understand customer behavior. It helps organizations uncover trends, solve problems, and enhance overall business performance efficiently. Below are some of the important applications:
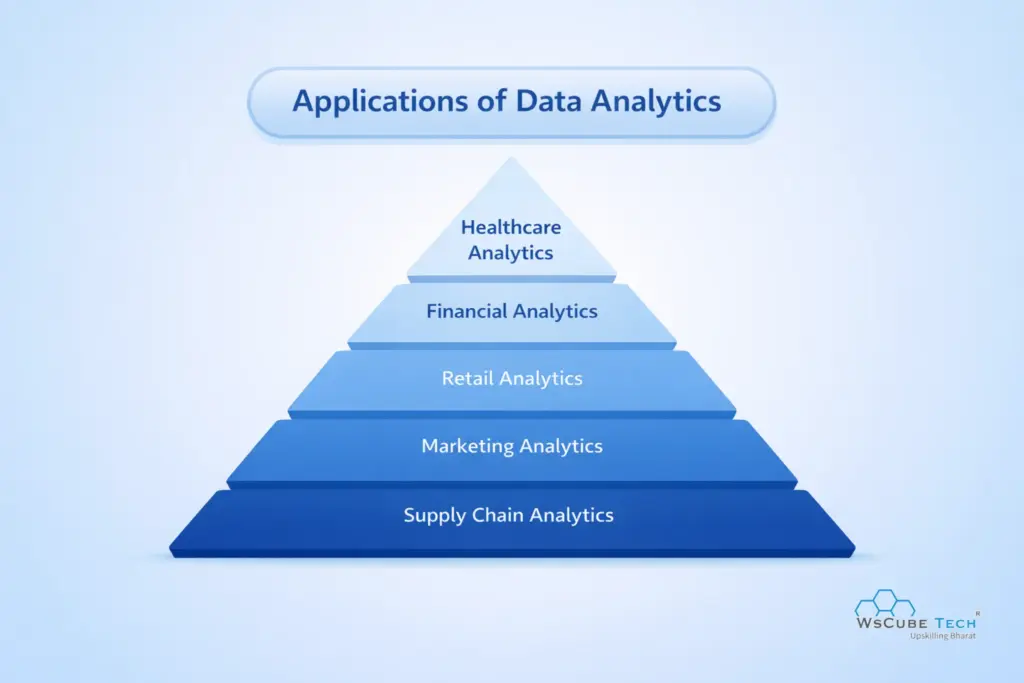
- Healthcare Analytics: Data analytics helps healthcare providers improve patient care by analyzing medical records, predicting disease outbreaks, and optimizing treatment plans, ensuring better health outcomes and operational efficiency.
- Financial Analytics: Organizations use analytics to detect fraud, assess and manage risks, forecast market and financial trends, and optimize investment strategies, enabling smarter decision-making and improving profitability, efficiency, and overall performance in the finance sector.
- Retail Analytics: Retailers use data to understand customer preferences, optimize inventory, create personalized marketing campaigns, and increase sales through targeted promotions, while enhancing the overall shopping experience and customer satisfaction.
- Marketing Analytics: Analytics tracks campaign performance, customer engagement, and social media trends, helping marketers create effective strategies, improve ROI, and reach the right audience efficiently.
- Supply Chain Analytics: Data analytics helps improve supply chain efficiency by tracking shipments, managing inventory, predicting demand, and reducing operational costs through better planning and logistics management.
These applications demonstrate how data analytics helps organizations optimize efficiency, make informed decisions, and achieve long-term business growth.
Here is a dashboard that shows an example of data analytics in action, displaying key metrics such as sales, transactions, earnings, and product performance through charts, graphs, and visual summaries. It helps users monitor trends, track performance, and make informed business decisions based on real-time data insights for better planning.
Read More Data Related Blogs
| Scope of Data Analytics | In-Demand Data Analyst Skills |
| Top Data Analyst Career Paths | Data Analyst Job Description |
| What Does a Data Analyst Do? | Data Analytics Tools & Software |
Benefits of Data Analytics
Data analytics helps organizations make better decisions, enhance business processes, understand customer needs, and identify growth opportunities. Below are the benefits of data analytics:
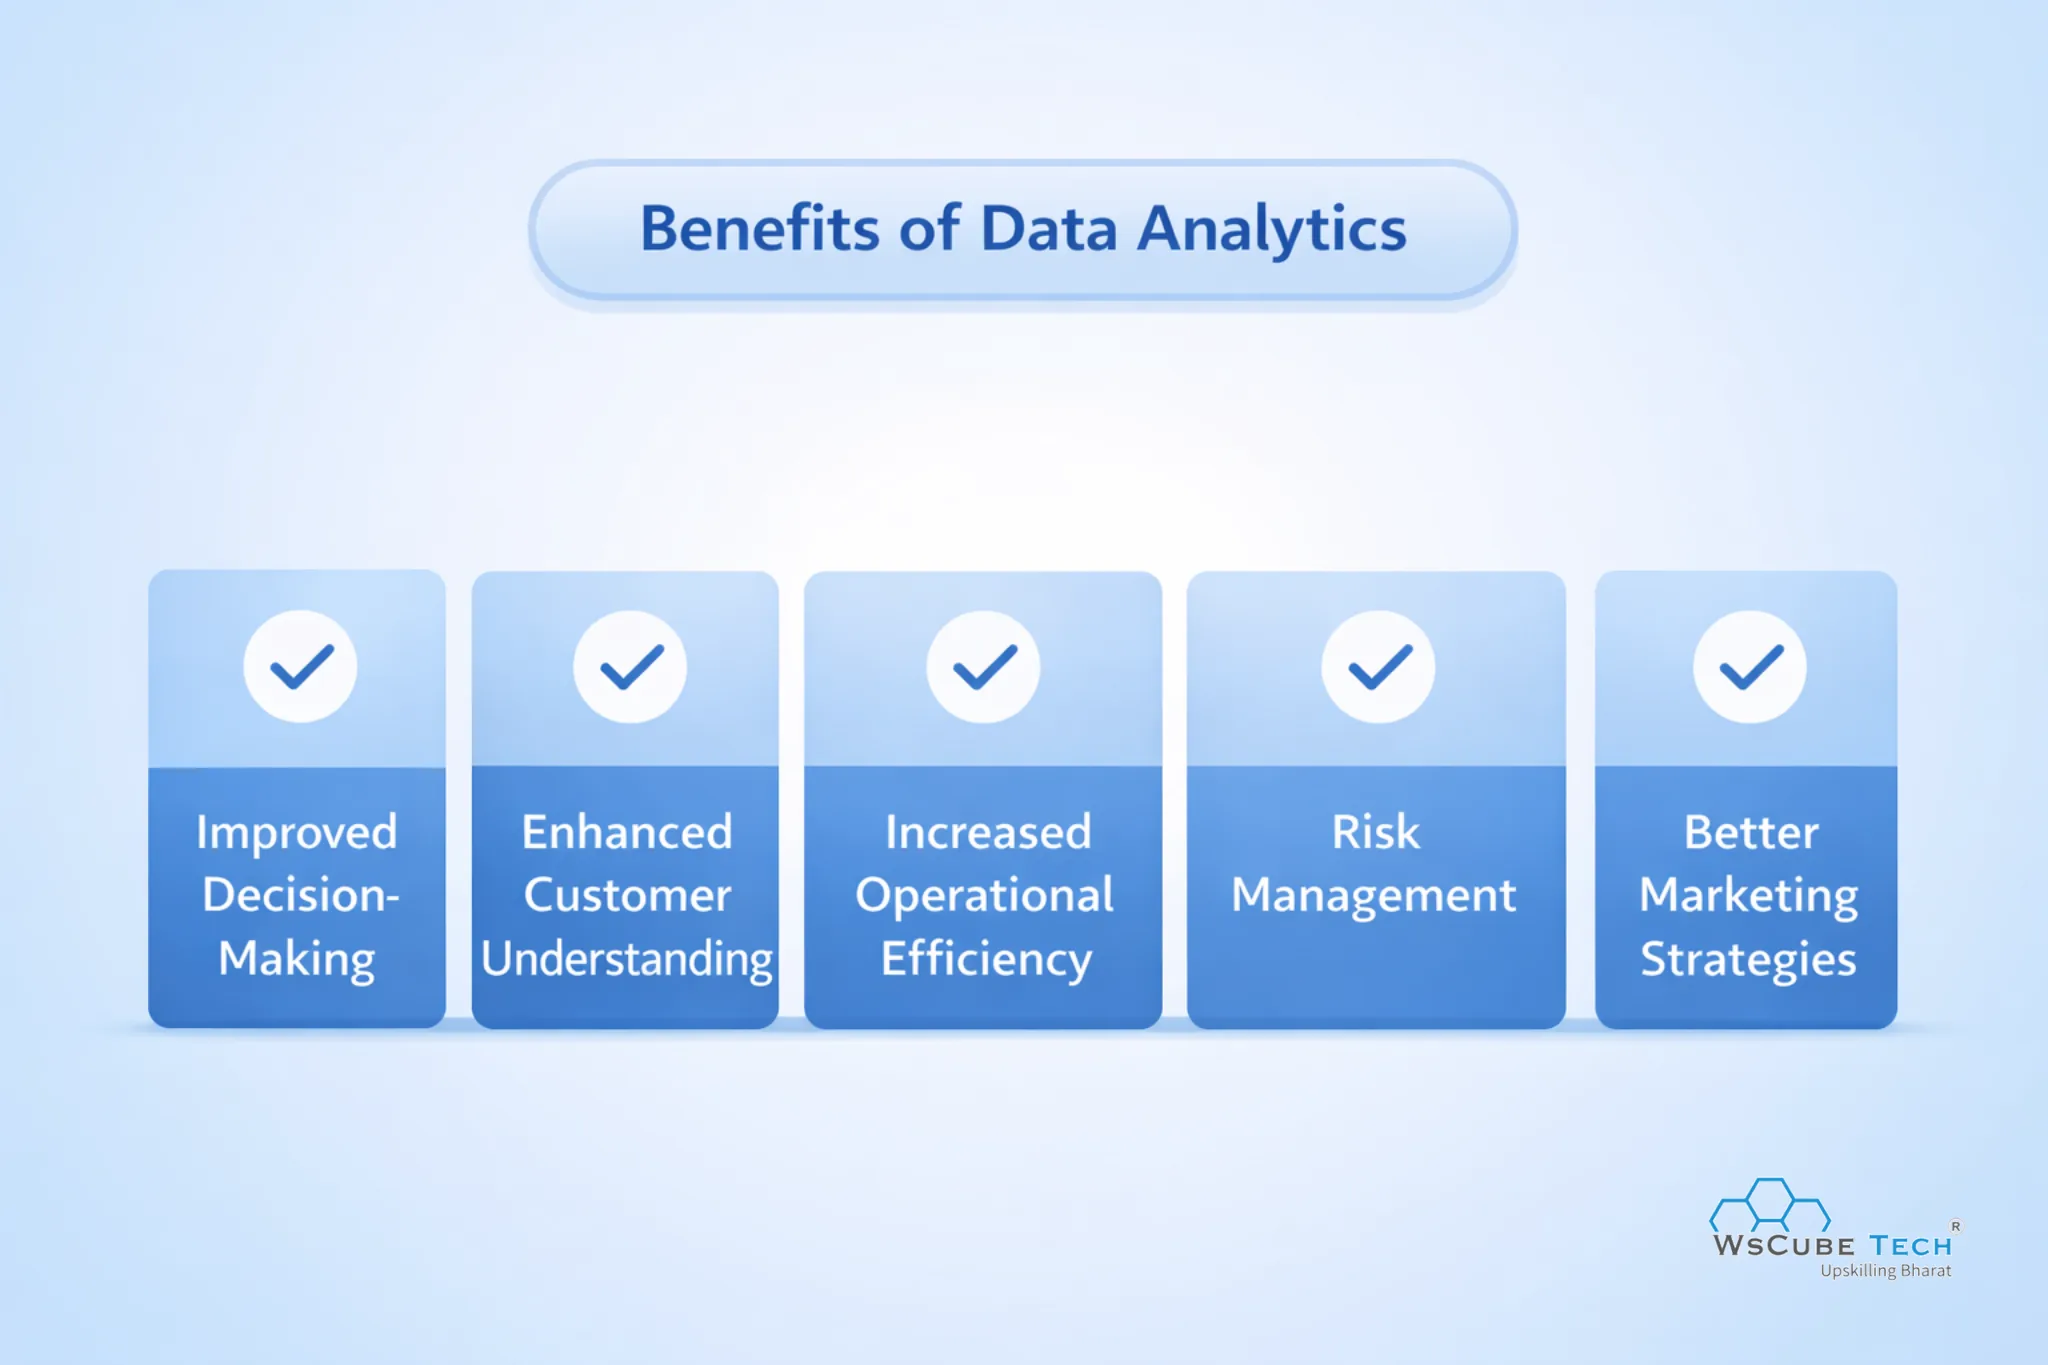
- Improved Decision-Making: Data analytics delivers accurate insights from historical and real-time data, helping organizations make informed decisions, reduce uncertainty, and plan strategies effectively for better business outcomes and performance.
- Enhanced Customer Understanding: Analyzing customer data allows businesses to understand preferences, behaviors, and needs more accurately. This enables personalized services, better engagement, and improved overall customer satisfaction.
- Increased Operational Efficiency: Data analytics helps identify inefficiencies in business operations, optimize workflows, and reduce unnecessary costs by improving resource utilization and overall productivity across different departments.
- Risk Management: Organizations leverage data analytics to detect potential risks, prevent fraud, and minimize financial losses. By recognizing patterns and unusual activities, businesses can implement preventive measures proactively.
- Better Marketing Strategies: Data analytics helps marketers analyze campaign performance, understand customer preferences, identify the right target audience, and optimize marketing strategies. This improves customer reach, increases engagement, enhances conversion rates, and maximizes return on investment for better business results.
These benefits show how data analytics supports organizations in improving performance, reducing risks, and achieving long-term business growth.
Also Read: Top Programming Languages for Data Analytics
Challenges in Data Analytics
Data analytics offers immense benefits, but organizations often face challenges in handling large datasets, ensuring data quality, selecting the right tools, and interpreting results accurately for effective decision-making.
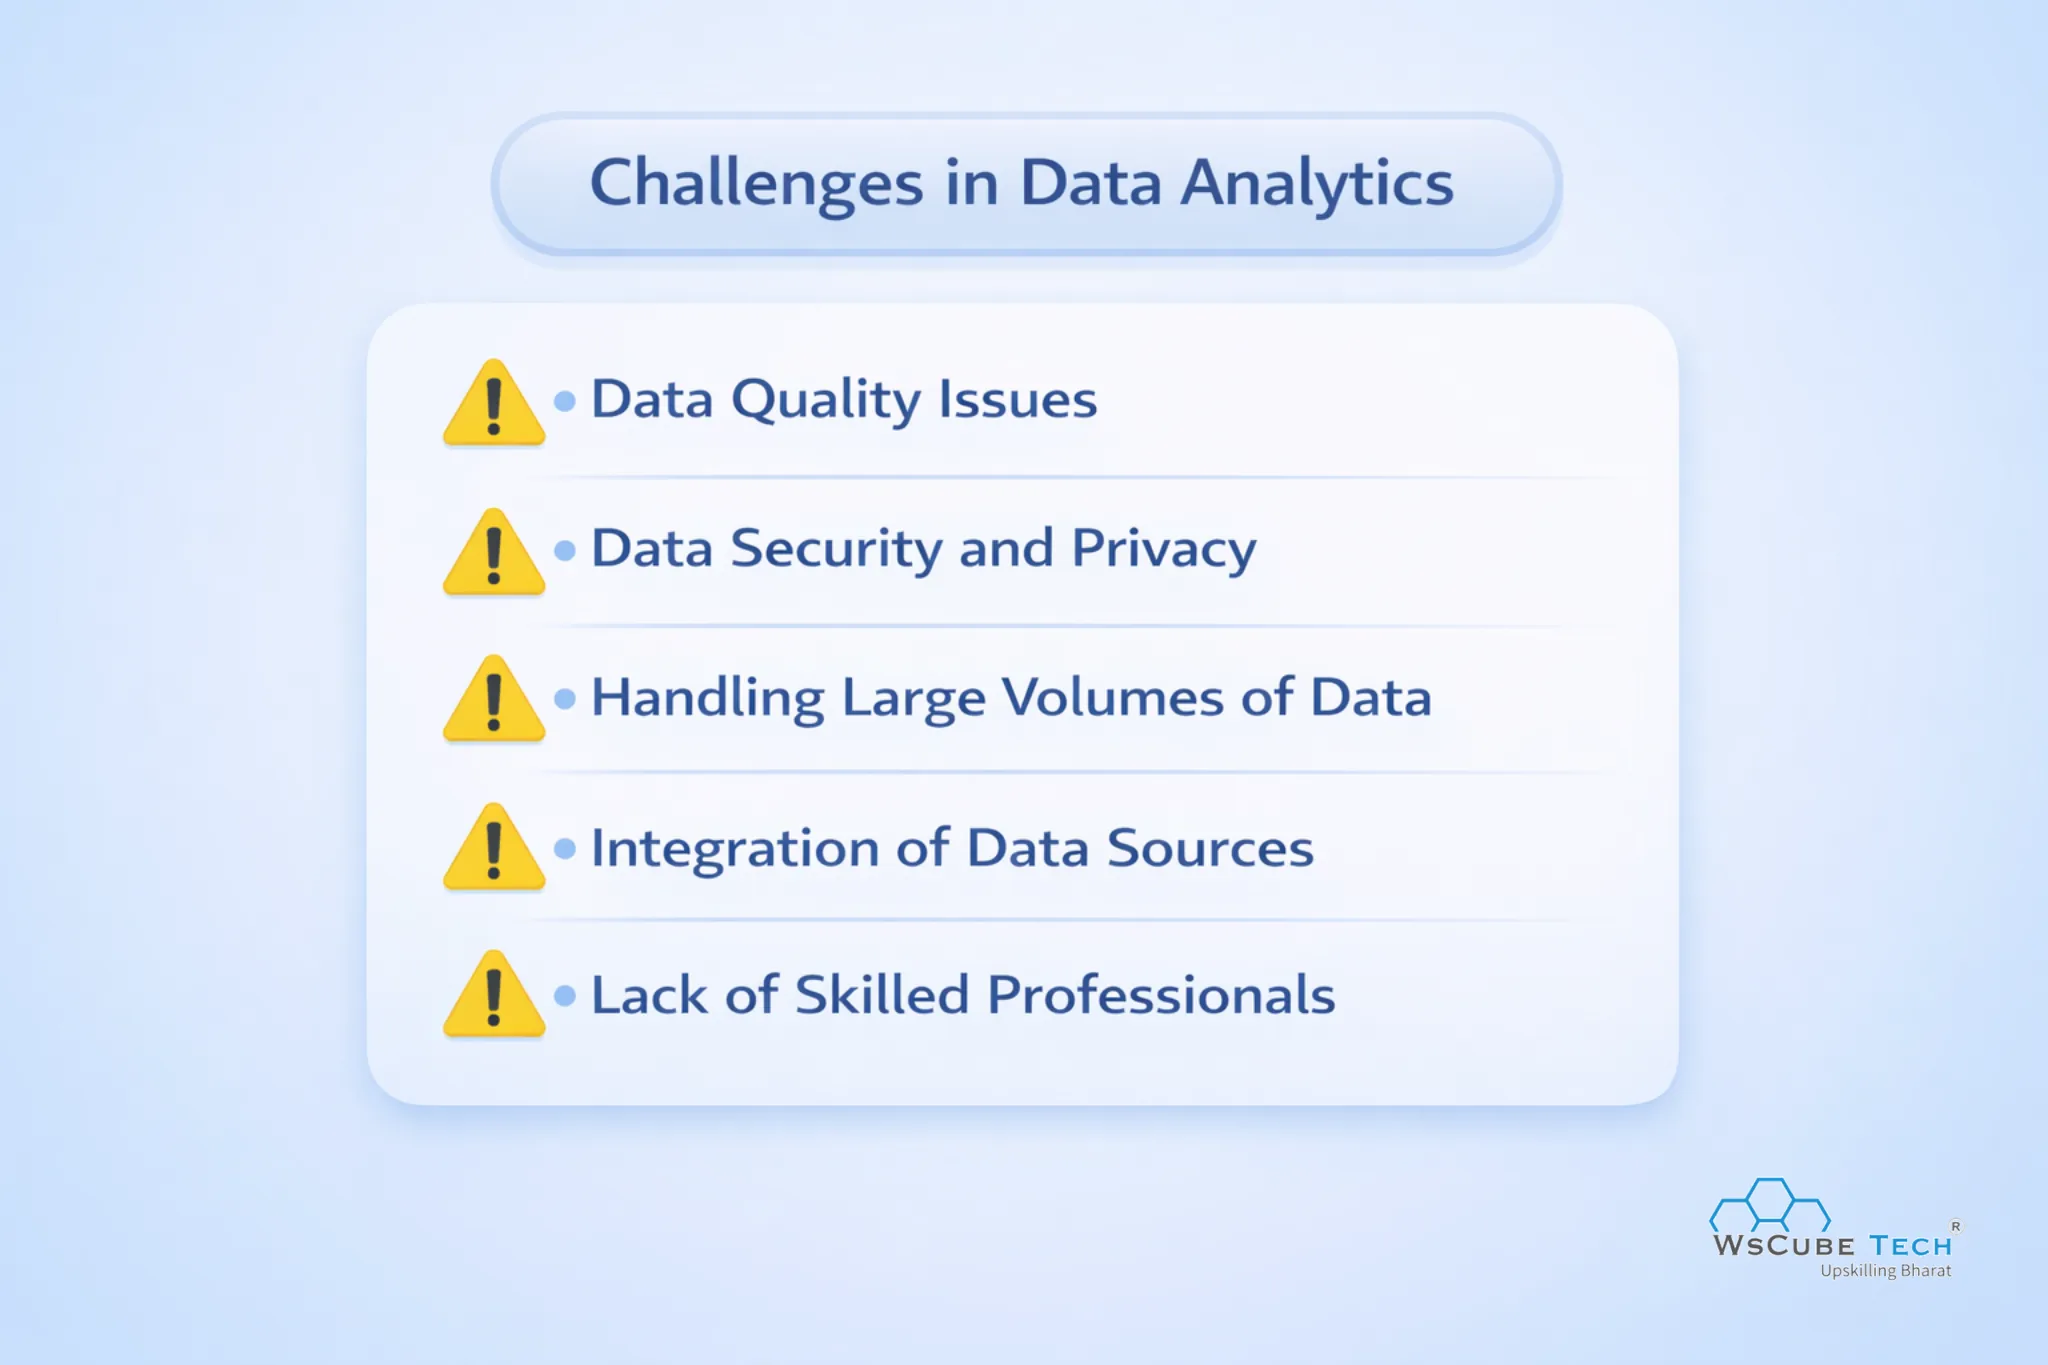
- Data Quality Issues: Poor-quality data, including missing, inconsistent, or inaccurate information, can result in incorrect insights and unreliable decisions. Maintaining clean, consistent, and accurate data is important for precise analysis and meaningful outcomes.
- Data Security and Privacy: Protecting confidential data is a key challenge in data analytics. Organizations must follow strong security practices to safeguard information from unauthorized access, prevent data breaches, and comply with privacy regulations.
- Handling Large Volumes of Data: Large amounts of structured and unstructured data can be difficult for organizations to manage. It requires efficient storage systems, strong computing capabilities, and advanced analytics tools for effective processing and accurate analysis.
- Integration of Data Sources: Integrating data from various sources such as databases, cloud platforms, and applications can be challenging. However, it is essential to ensure comprehensive and accurate analysis for better decision-making.
- Lack of Skilled Professionals: Finding professionals who can analyze data, apply advanced techniques, and interpret results correctly remains a significant challenge for many organizations.
These challenges highlight the importance of proper data management and skilled expertise for successful data analytics implementation.
Data Analytics vs Data Science
Below are the key differences between Data Analytics and Data Science:
| Basis | Data Analytics | Data Science |
| Definition | Focuses on analyzing historical data to identify trends and support decision-making. | Focuses on extracting insights from structured and unstructured data using advanced techniques. |
| Objective | Helps understand past performance and improve current business processes. | Aims to predict future outcomes and build intelligent data-driven solutions. |
| Data Type | Works mainly with structured data from databases and spreadsheets. | Works with structured and unstructured data such as text, images, and video files. |
| Techniques Used | Uses statistical analysis, data visualization, and reporting methods. | Uses machine learning, data mining, and advanced statistical modeling techniques. |
| Programming Knowledge | Requires basic knowledge of SQL and sometimes basic scripting (Python or R). | Requires programming skills in languages like Python, R, and advanced tools. |
| Complexity Level | Less complex and focuses on descriptive and diagnostic analysis. | More complex and involves predictive and prescriptive modeling. |
| Tools Used | Excel, SQL, Tableau, Power BI, Google Analytics | Python, R, Hadoop, Spark, TensorFlow, Scikit-learn |
| Outcome | Generates reports and dashboards for business insights. | Builds predictive models and intelligent systems for future forecasting. |
| Role in Business | Supports operational decision-making. | Supports strategic planning and automation of decision-making processes. |
Also Read: Data Scientist Roadmap
Skills Required for Data Analytics
To build a successful career, you need a mix of technical, analytical, and problem-solving abilities. Developing strong data analytics skills will help you analyze data efficiently and make informed decisions.
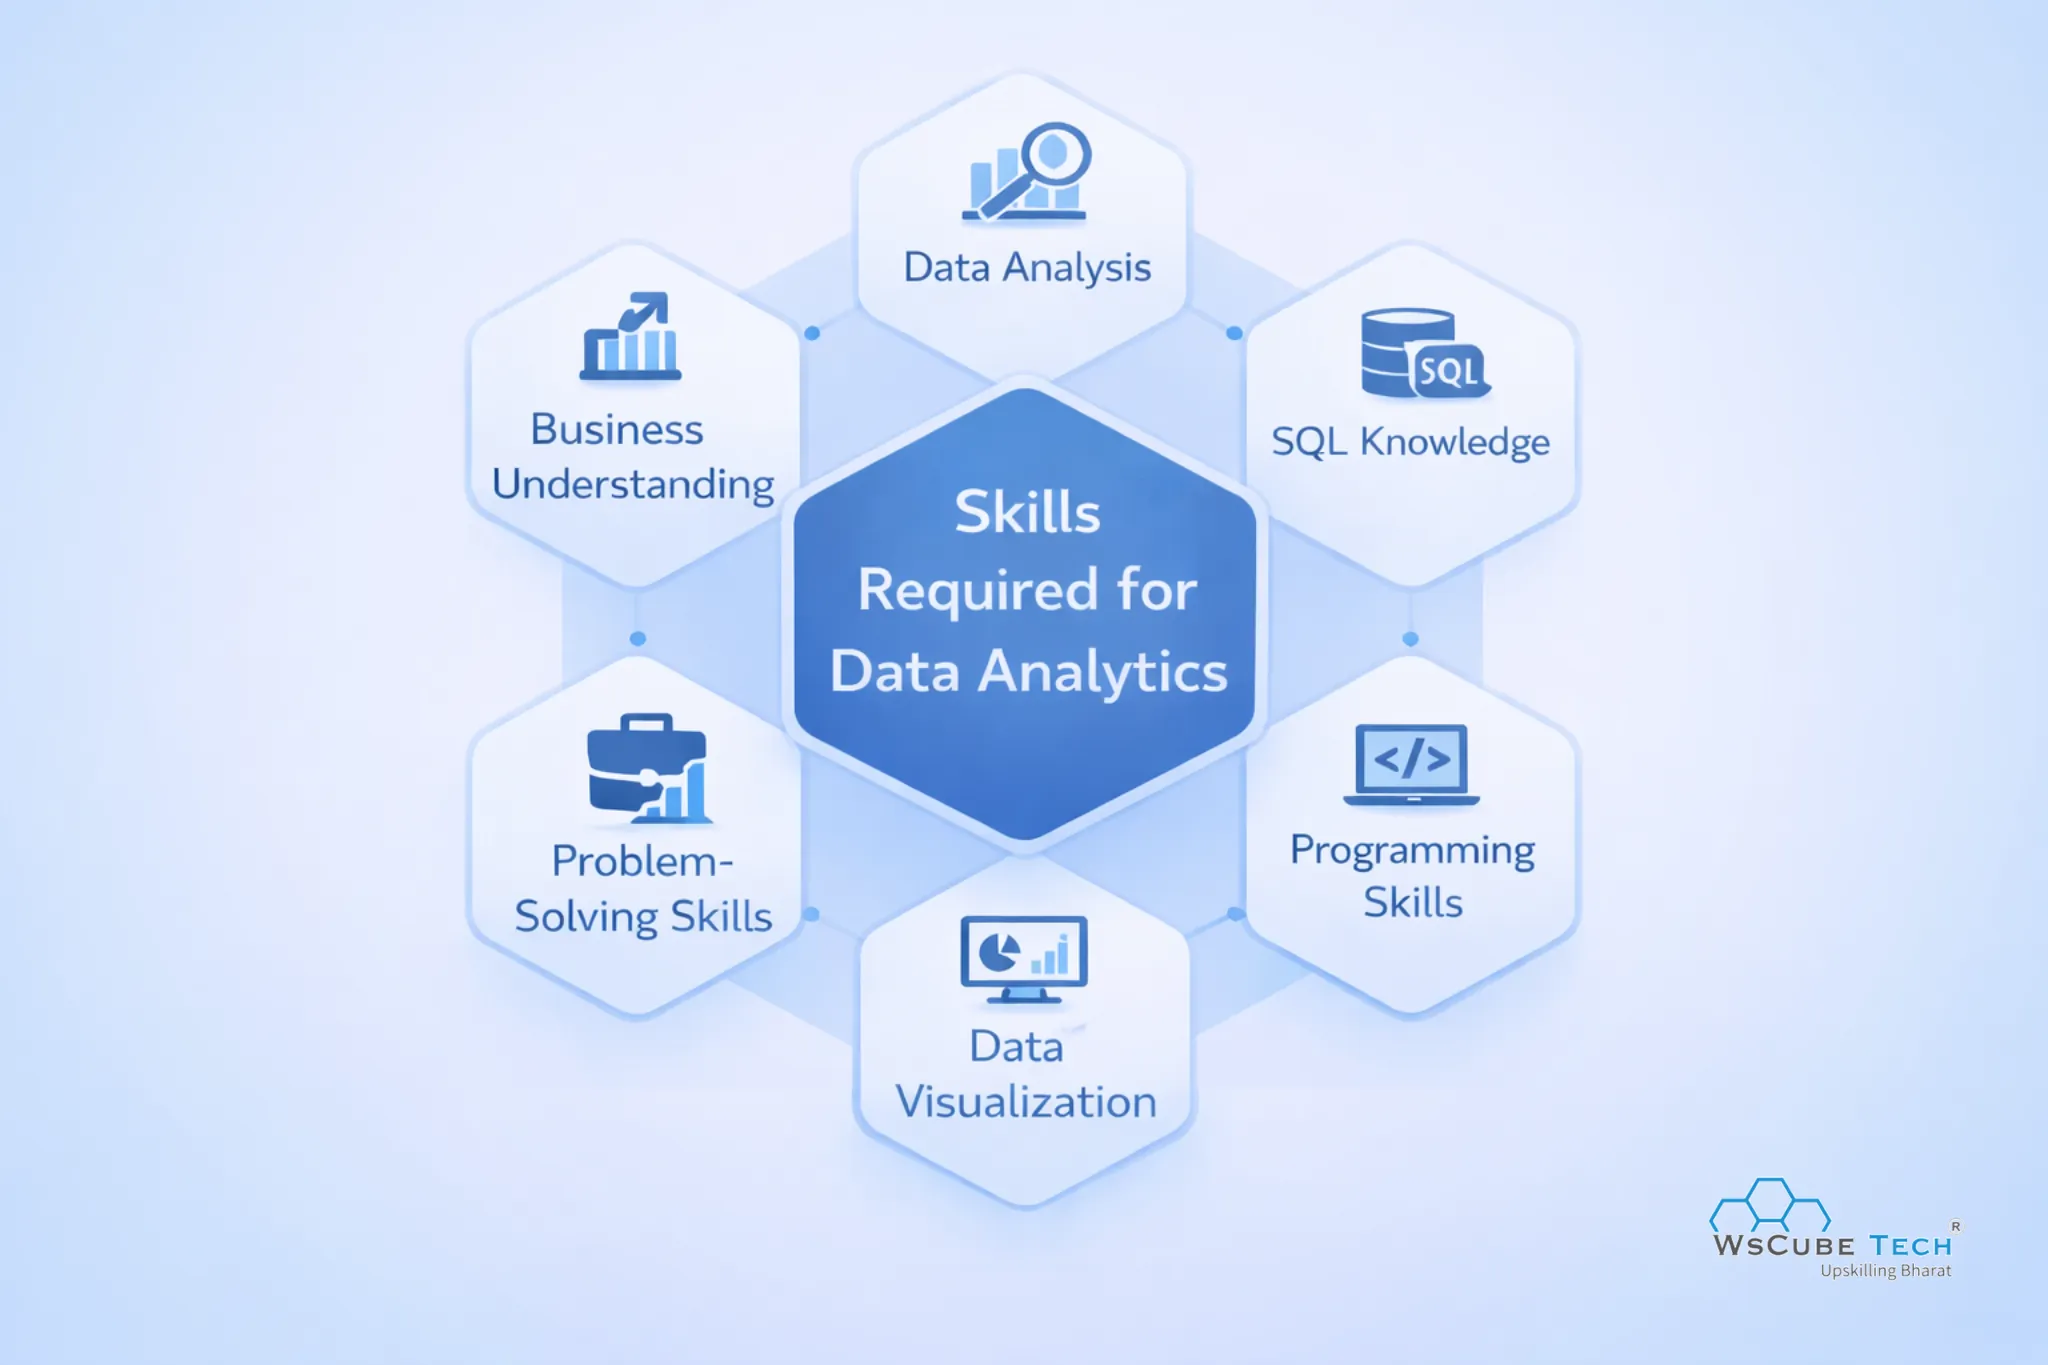
- Data Analysis: Exploring datasets to identify trends, patterns, and anomalies enables the extraction of actionable insights, supporting organizations in improving processes, enhancing performance, and making effective data-driven business decisions.
- SQL Knowledge: Understanding SQL allows users to query, manage, and manipulate data from relational databases, ensuring accurate extraction and transformation of information for analysis purposes.
- Programming Skills: Knowledge of Python or R is essential for advanced data manipulation, statistical analysis, automation, and working with machine learning algorithms to enhance your analytics capabilities.
- Data Visualization: Creating charts, dashboards, and visual reports using tools like Power BI or Tableau helps present insights clearly and supports stakeholders in understanding trends for better decision-making.
- Business Understanding: Interpreting data in the context of organizational goals, industry trends, and market conditions is essential to ensure insights are relevant, actionable, and aligned with business strategies, supporting effective decision-making.
- Problem-Solving Skills: Identifying issues, evaluating alternatives, and developing practical solutions using logical reasoning and data-driven approaches support effective business growth.
- Communication Skills: Presenting technical insights clearly in simple language helps stakeholders understand findings and make informed decisions based on data analysis.
By continuously developing these data analytics skills, you can stay relevant in the industry, adapt to changing technologies, and contribute effectively to any data-driven organization.
Explore Our Data Related Courses
| Online Data Analytics Course | Live Internship + 100% Job Support |
| Online Business Analytics Course | Live Internship + 100% Job Support |
| Online Data Science Course | Live Internship + 100% Job Support |
Career Opportunities in Data Analytics
Data analytics offers a diverse range of career paths for professionals who can interpret data, generate insights, and support data-driven decision-making in various industries. Skills in analytics, visualization, and problem-solving are highly valuable.
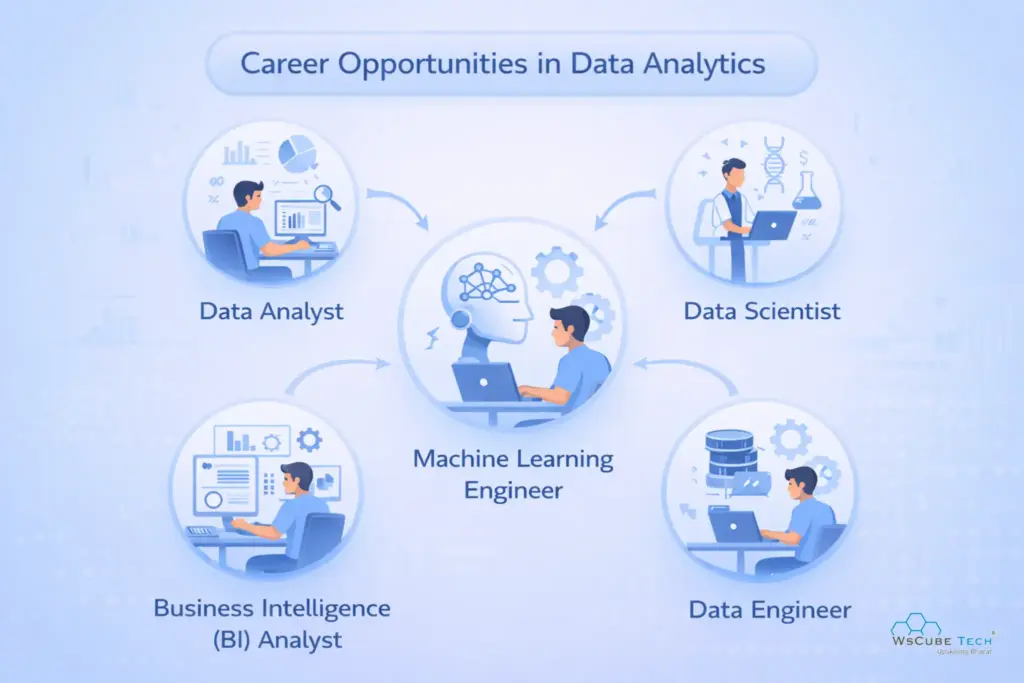
- Data Analyst: Collects, organizes, and examines datasets to identify trends, patterns, and insights. Creates visual reports and dashboards that guide organizations in making informed, data-driven decisions, improving overall business performance and operational efficiency.
- Data Scientist: Uses advanced statistical models, machine learning, and AI algorithms to analyze complex data. Builds predictive models and intelligent systems that support strategic decision-making and solve high-level business challenges effectively.
- Business Intelligence (BI) Analyst: Transforms raw data into meaningful reports, dashboards, and visualizations. Provides actionable insights that help organizations optimize strategies, enhance performance, and make informed operational and strategic business decisions.
- Machine Learning Engineer: ML engineers develop algorithms and predictive models to analyze data. They implement AI solutions that automate processes, improve efficiency, and support advanced analytics initiatives in organizations.
- Data Engineer: Designs, builds, and maintains data pipelines and architectures. Ensures reliable data flow, integration, and storage for analysis, modeling, and AI applications, supporting seamless access to high-quality datasets for analytics teams.
Overall, careers in data analytics are expanding rapidly. Professionals with strong analytical, technical, and problem-solving skills can explore diverse roles, contribute to business growth, and thrive in a data-driven world.
Data Analytics Salary in India
Data Analytics Salary in India varies depending on experience, skills, and industry. Entry-level professionals earn a modest amount, while experienced analysts with advanced skills and domain knowledge can command higher packages. The field continues to grow, offering competitive pay and opportunities for career growth.
| Experience Level | Average Salary (LPA) |
| Entry-Level (0–2 years) | 4 – 6 LPA |
| Intermediate (2–5 years) | 6 – 12 LPA |
| Experienced (5+ years) | 12+ LPA |
Salaries increase with expertise in tools like SQL, Python, and Power BI, along with strong analytical skills. Data analysts with domain specialization, certifications, or experience in AI and machine learning often receive higher compensation, reflecting their value to organizations.
Recommended Professional Certificates
Data Analytics Course with Gen AI
Data Science Course with Internship & Placement Support
How to Get Started with Data Analytics?
Getting started with data analytics may seem confusing at first, but anyone can build a strong foundation by learning the basics. Understanding different data types, data collection methods, and data cleaning techniques is important. It is also essential to become familiar with tools like Excel, SQL, and Python to analyze datasets effectively and extract meaningful insights.
Next, practice applying analytical techniques to real-world scenarios. Working on projects, case studies, and sample datasets helps in understanding patterns, trends, and practical business applications of data analytics. Hands-on experience plays an important role in strengthening learning and preparing for industry challenges.
Finally, focus on developing advanced data analytics skills such as predictive analytics, data visualization, and reporting. To gain structured guidance and practical experience, you can join our online data analytics course at WsCube Tech, designed to help beginners become industry-ready professionals.
Also Read: Data Analyst Roadmap
Data Analyst Roadmap 2026 (Detailed Video Guide)
FAQs About Data Analytics
Data analytics is the process of examining raw data to find patterns, trends, and insights. You can use it to make better decisions, solve problems, and improve business performance by understanding data effectively.
You can work with four main types of data analytics: descriptive, diagnostic, predictive, and prescriptive. Each type answers different questions, helping you understand what happened, why, what might happen, and what actions should be taken.
The data analytics process involves collecting data, cleaning it, organizing the information, analyzing patterns, and interpreting results. This process helps you extract meaningful insights that support decision-making and improve business strategies effectively.
Data analytics helps you identify trends, solve problems, and make data-driven decisions. It improves efficiency, reduces risks, and guides business strategies, ensuring your organization remains competitive in a rapidly evolving market.
To become a data analyst, you need skills like data analysis, SQL knowledge, programming, data visualization, problem-solving, and communication. These data analytics skills help you analyze data effectively and make informed decisions.
You can use tools like Excel, SQL, Python, R, Tableau, Power BI, and Google Analytics. These tools help you clean, analyze, visualize, and report data efficiently, making your analytics work easier and more effective.
Structured data is organized in databases, spreadsheets, or rows and columns, while unstructured data includes text, images, and videos. You handle both types differently to extract insights using appropriate data analytics tools.
Data visualization involves creating charts, graphs, and dashboards to display insights clearly. You use it to make complex data easy to understand, helping stakeholders quickly interpret trends, patterns, and actionable information.
SQL is a programming language used to query and manage databases. You use it to extract, filter, and manipulate data, making it a crucial skill for analyzing large datasets efficiently.
Regression analysis helps you understand relationships between variables and predict outcomes. You use it to make forecasts, identify trends, and make data-driven decisions that guide business strategies effectively.
Exploratory Data Analysis (EDA) involves examining and summarizing datasets to find patterns, trends, anomalies, and relationships. It helps you understand the data, clean it, and prepare it for advanced analytics, modeling, or predictive analysis for accurate business insights.
You may face challenges like poor data quality, missing or inconsistent information, large datasets, and integrating multiple data sources. Overcoming these issues requires strong technical and problem-solving skills in data analytics.
Businesses benefit from data analytics by improving decision-making, identifying new opportunities, reducing operational costs, and enhancing customer experiences. It helps optimize processes, increase efficiency, predict trends, and gain a competitive advantage in an increasingly data-driven market environment.
Yes, you can. You can start with basics like Excel, SQL, and visualization tools, then gradually learn Python or R. With practice and structured learning, you can develop strong data analytics skills regardless of your background.
Conclusion
Data analytics has become an essential part of modern business operations by helping organizations convert raw data into valuable insights. It supports better decision-making, improves efficiency, and helps businesses understand customer behavior and market trends more effectively.
With the growing demand for data-driven strategies, learning data analytics tools and techniques can open new career opportunities across various industries. Developing strong analytical skills helps professionals solve real-world problems and contribute to business growth in today’s competitive environment.
Join Our On-Campus Data Analytics Program


Leave a comment
Your email address will not be published. Required fields are marked *Comments (0)
No comments yet.