
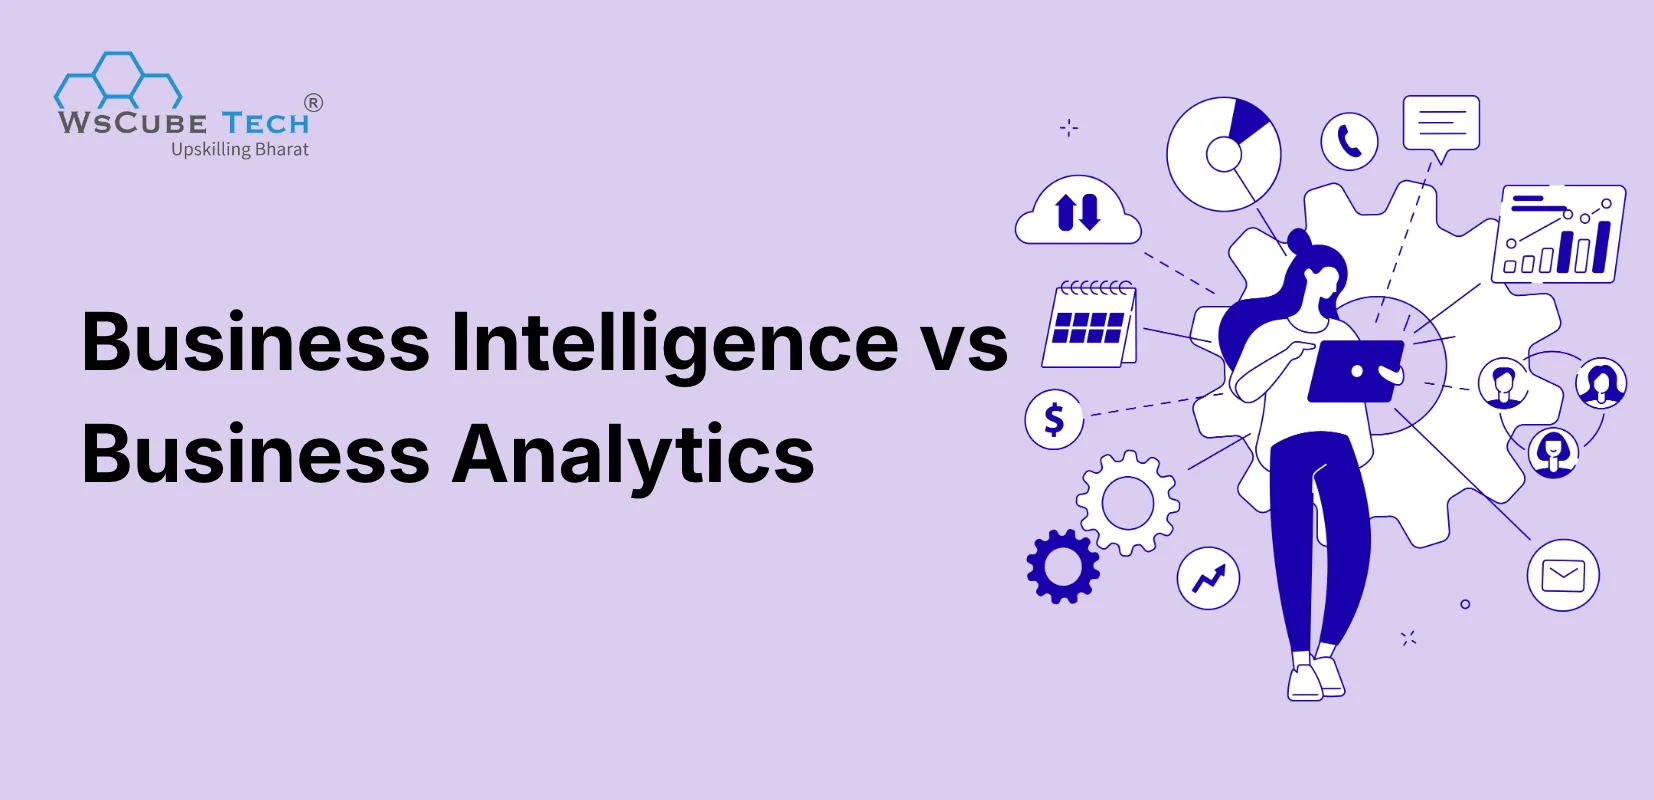
Think about the screen time report on your phone. It tells you that you spent four hours on Instagram last week. Useful, right? But it does not tell you why, or how to cut it down next week. That small gap is exactly what the business intelligence vs business analytics debate is all about.
Companies face the same challenge, just on a much bigger scale. They collect sales numbers, website clicks, and customer reviews every day. Business intelligence helps organize this information into reports and dashboards, while business analytics uses data analysis, statistics, and predictive techniques to uncover patterns and support better decisions. Both work together to help businesses understand performance and plan their next steps.
If you are a student planning a career in data, this difference matters because it shapes the skills and job roles you pick. Let’s break it down in simple words.
Key Takeaways
- Business intelligence (BI) helps businesses monitor performance through reports, dashboards, and data visualization.
- Business analytics (BA) uses data analysis, statistics, and modeling to identify patterns, understand business problems, and support future decisions.
- BI and BA overlap in their use of data, tools, and analytical techniques, but their primary objectives can differ.
- Both fields commonly use Excel, SQL, Power BI, and Tableau.
- BI roles often focus on reporting, dashboards, and data management, while BA roles involve deeper analysis and business decision support.
- Career opportunities in both fields depend on practical skills, experience, and the complexity of the role.
- Both disciplines are being influenced by AI, automation, and growing business demand for data-driven decisions.
- Students can begin with Excel, SQL, and Power BI before developing statistics, analytical thinking, and forecasting skills.
Upcoming Masterclass
Attend our live classes led by experienced and desiccated instructors of Wscube Tech.






What Is Business Intelligence?
Business intelligence (BI) is the process of collecting, organizing, analyzing, and presenting business data so teams can understand performance and make informed decisions. It converts data from different sources into reports, dashboards, and visualizations that help managers monitor key metrics, identify trends, and investigate business performance. While BI commonly focuses on descriptive reporting, modern BI platforms can also support more advanced analytical tasks.
Key features of business intelligence:
- Gathers data from many sources, like sales systems, CRMs, and spreadsheets, into one place
- Uses data warehouses to store clean and structured data
- Presents information through dashboards, reports, and KPIs (key performance indicators)
- Supports quick, day-to-day decisions
- Works mostly with historical and real-time data
Simple example: A clothing store chain uses a BI dashboard that shows daily sales for every branch. The manager notices that the Jaipur store sold 30% fewer jackets this month compared to last month. The dashboard helps the manager identify the decline and investigate where performance has changed. Further analysis can help uncover the reasons behind it.
What Is Business Analytics?
Business analytics (BA) uses data, statistical techniques, and analytical models to understand business performance, identify patterns, and support decision-making. It involves examining historical and current data to investigate business problems, evaluate different possibilities, and forecast potential outcomes. Depending on the business objective, it may also use machine learning and predictive modeling to recommend suitable actions.
Key features of business analytics:
- Finds the root cause behind changes in data
- Uses statistical analysis, regression, and forecasting
- Builds predictive models to estimate future results
- Suggests actions through prescriptive analytics
- Supports long-term planning and strategy
Simple example: The same clothing store now wants to know why jacket sales dropped. A business analytics professional studies weather data, pricing, and competitor offers. They find that a warmer winter and a nearby discount sale caused the drop. They then forecast next month's demand and suggest reducing jacket stock by 20%. BA tells the store why it happened and what to do next.
Difference Between Business Intelligence and Business Analytics
Business intelligence and business analytics both use business data to support better decisions, but they differ in their primary objectives, approaches, and outputs. BI focuses on monitoring business performance through reports and dashboards, while BA uses analytical techniques to investigate problems, identify patterns, forecast outcomes, and recommend actions.
The following table highlights the key differences between the two fields:
| Factor | Business Intelligence (BI) | Business Analytics (BA) |
| Main objective | Monitor and understand business performance | Investigate business problems and support better decisions |
| Key questions | What happened? What is happening? | Why did it happen? What could happen? What should we do? |
| Primary focus | Reporting, monitoring, and descriptive analysis | Diagnostic, predictive, and prescriptive analysis |
| Data type | Primarily structured, historical, and real-time data | Structured and unstructured data, depending on the use case |
| Techniques | Data querying, data warehousing, OLAP, and data visualization | Statistical analysis, data mining, regression, forecasting, and machine learning |
| Tools | Power BI, Tableau, Qlik Sense, Looker, SAP BusinessObjects | Excel, SQL, Python, R, SAS, SPSS, and Alteryx |
| Skills required | SQL, Excel, data visualization, and reporting | SQL, Excel, statistics, analytical modeling, and problem-solving |
| Typical users | BI analysts, business managers, operations teams, and executives | Business analytics professionals, data analysts, data scientists, and strategy teams |
| Main output | Dashboards, reports, scorecards, and performance metrics | Analytical findings, forecasts, what-if scenarios, and recommendations |
| Approach | Primarily focused on monitoring and reporting business performance | Focused on investigating problems and supporting future decisions |
Similarities Between Business Intelligence and Business Analytics
Despite their differences, business intelligence and business analytics share several common aspects. Both fields rely on business data to help organizations understand performance, identify opportunities, and make informed decisions. Most organizations use them together to get a complete picture of their operations.
Here are some key similarities:
| Factor | How BI and BA Are Similar |
| Main objective | Both aim to help businesses make better, data-driven decisions. |
| Data requirements | Both rely on clean, accurate, and well-organized data. |
| Techniques | Both use data cleaning, SQL queries, and data visualization. |
| Tools | Both commonly use Excel, SQL, Power BI, and Tableau. |
| Users | Both support business leaders, managers, and decision-makers. |
| Output | Both generate insights that can be communicated through charts, reports, and presentations. |
| Business impact | Both help organizations improve efficiency, identify opportunities, and achieve business goals. |
Are Business Intelligence and Business Analytics the Same?
No, business intelligence and business analytics are closely related but have different primary objectives. BI primarily helps organizations monitor performance through reports, dashboards, and data visualization. BA goes further into investigating business problems, identifying patterns, and using analytical techniques to support decisions. However, both disciplines overlap in their tools, data, and methods.
- Different objectives: BI focuses on monitoring business performance, while BA emphasizes deeper analysis and decision support.
- Different questions: BI commonly answers "What happened?" and "What is happening?" BA also explores "Why did it happen?" and "What could happen next?"
- Different techniques: BI commonly uses reporting, querying, and visualization, while BA may involve statistical analysis, forecasting, and predictive modeling.
- Different outputs: BI produces dashboards and performance reports, while BA can produce analytical findings, forecasts, and recommendations.
- Shared foundation: Both use company data and tools like Excel, SQL, and Power BI.
- Work together: BI helps teams monitor business performance, while BA can investigate the patterns behind it and evaluate possible actions. Both contribute to better business decisions.
Business Intelligence vs Business Analytics vs Data Analytics
Students and beginners often confuse business intelligence, business analytics, and data analytics because all three work with data. While they overlap in tools and techniques, each field has a different main focus.
- Business Intelligence (BI): Focuses on monitoring past and current business performance through dashboards, reports, and KPIs. It answers "what happened?"
- Business Analytics (BA): Focuses on solving business problems, finding patterns, and forecasting future outcomes to guide business decisions. It answers "why did it happen?" and "what should we do?"
- Data Analytics (DA): Focuses on cleaning, organizing, and analyzing raw datasets to find trends across different areas like tech, healthcare, or finance. It is broader and more technical than business-focused roles.
In short, data analytics is the broad umbrella of working with data, BI uses that data to track business performance, and BA uses it to plan future business strategy.
Business Intelligence vs Business Analytics: Real-World Examples
Imagine a clothing retail company notices that jacket sales have dropped by 30% compared to the previous month. It uses both Business Intelligence (BI) and Business Analytics (BA) to understand and address the problem.
- Business Intelligence (BI): The company uses Power BI dashboards to track monthly sales, compare store performance, monitor inventory, and identify which locations have experienced the biggest decline in jacket sales.
- Business Analytics (BA): The analytics team investigates the reasons behind the decline by examining weather patterns, customer buying behavior, product pricing, and competitor discounts. It then uses historical sales data and forecasting techniques to estimate future demand and recommend inventory adjustments.
How they work together: BI helps the company monitor sales performance and identify where the problem exists, while BA helps investigate possible reasons and evaluate what actions to take. The company can then use BI dashboards to track whether those decisions improve sales.
How Business Intelligence and Business Analytics Work Together
Most successful companies do not choose between business intelligence and business analytics. Instead, they use both together as a step-by-step process to make smart decisions.
- Step 1: BI spots the trend (What happened?): BI dashboards collect daily data and show that website traffic or product sales have changed.
- Step 2: BA finds the reason (Why did it happen?): Business analytics professionals dig deeper into customer behavior, pricing, and market trends to find the root cause.
- Step 3: BA predicts and suggests (What next?): Using forecasting and models, BA estimates future results and recommends the best action to take.
- Step 4: BI tracks the result (Did it work?): Once the company makes a change, BI dashboards monitor the new numbers to see if performance improves.
When BI and BA work together, companies get both a clear view of their daily operations and a reliable plan for future growth.
Business Intelligence vs Business Analytics: Tools
Tools are where BI vs business analytics often overlap. Many beginner tools work for both, while advanced tools lean more toward one side.
| Tool | Used Mainly For | BI or BA | What It Does |
| Microsoft Power BI | Dashboards and reports | Both (mainly BI) | Connects to data and builds interactive dashboards |
| Tableau | Data visualization | Both (mainly BI) | Turns data into clear charts and visual stories |
| Qlik Sense | Self-service BI | BI | Lets users explore data and find links between data sets |
| Looker (Google) | Cloud reporting | BI | Builds reports on top of cloud data warehouses |
| SAP BusinessObjects | Enterprise reporting | BI | Handles large-scale reporting for big companies |
| Microsoft Excel | Analysis and modeling | Both | Handles formulas, pivot tables, and basic forecasting |
| SQL | Data querying | Both | Pulls and filters data from databases |
| Python | Advanced analysis | BA | Runs statistics, predictive models, and automation |
| R | Statistical modeling | BA | Performs deep statistical analysis and visualization |
| SAS | Predictive analytics | BA | Used in banking and healthcare for advanced modeling |
| Alteryx | Data preparation and analytics | BA | Automates data cleaning and predictive workflows |
For more clarity, explore a detailed list of top business analytics tools to learn more about each one.
Business Intelligence vs Business Analytics: Skills
Both fields need a strong data foundation, but BA asks for more math and problem-solving. Here is how the key skills compare:
| Skill | Needed for BI | Needed for BA | Why It Matters |
| SQL | High | High | Used to pull and filter data from databases |
| Excel | High | High | Helps with quick analysis, pivot tables, and charts |
| Data visualization | High | Medium | Makes data easy to understand for business teams |
| Dashboard design | High | Low | Core part of daily BI work |
| Data warehousing and ETL | High | Medium | Helps move and organize data from many sources |
| Statistics | Low | High | Needed to test ideas and find real patterns |
| Python or R | Low | High | Used for predictive models and automation |
| Machine learning basics | Low | Medium | Helps build forecasts and smart recommendations |
| Business and domain knowledge | Medium | High | Helps ask the right questions and suggest actions |
| Communication and storytelling | High | High | Helps explain findings to non-technical people |
| Problem solving | Medium | High | Needed to break down vague business problems |
Want a step-by-step roadmap to build these skills? Check out our complete guide on business analyst skills.
Business Intelligence vs Business Analytics: Salary
When it comes to business intelligence vs business analytics salary, both roles start at similar levels, but business analyst pay tends to climb higher in senior positions.
| Experience Level | BI Analyst Salary (India) | Business Analyst Salary (India) |
| Fresher (0 to 2 years) | ₹6.8 LPA to ₹7.5 LPA | ₹4 LPA to ₹7 LPA |
| Mid-level (2 to 5 years) | ₹9.4 LPA to ₹10.4 LPA | ₹8 LPA to ₹14 LPA |
| Senior (5 to 8 years) | ₹12.3 LPA to ₹13.6 LPA | ₹15 LPA to ₹22 LPA |
| Lead or Principal (8+ years) | ₹22.5 LPA to ₹31.2 LPA+ | ₹22 LPA to ₹35 LPA+ |
Note: BI analyst figures are based on AmbitionBox data by years of experience.
For a deeper breakdown by company and city, read our guide on business analyst salary in India.
Application of Business Intelligence and Business Analytics
Both BI and BA are used in almost every industry. Here is how each one helps in different sectors:
| Industry | How BI Is Used | How BA Is Used |
| Retail and e-commerce | Track daily sales, stock levels, and top products | Predict demand, plan discounts, and recommend products |
| Banking and finance | Monitor transactions, branch performance, and loans | Detect fraud, score credit risk, and predict customer churn |
| Healthcare | Track bed occupancy, patient flow, and staff schedules | Predict patient readmissions and disease trends |
| Manufacturing | Monitor production output and machine downtime | Predict machine failures and improve supply chains |
| Marketing | Report campaign clicks, leads, and conversions | Segment customers and predict which campaigns will work |
| Human resources | Track hiring, attendance, and employee turnover | Predict which employees may leave and plan workforce needs |
| Logistics | Monitor delivery times and fleet usage | Optimize delivery routes and forecast shipping volumes |
| Education | Track student attendance and course completion | Predict student dropouts and personalize learning |
Business Intelligence vs Business Analytics Careers
Both fields offer strong career paths, but the job roles, daily tasks, and growth tracks are a little different. Here is a complete differentiation.
1. Careers in Business Intelligence
Business Intelligence careers suit people who enjoy working with data, creating reports, monitoring business performance, and presenting insights through dashboards. These roles primarily focus on helping organizations understand past and current business performance. Popular job roles include:
- Business Intelligence Analyst: Analyzes business data and creates dashboards to track performance, trends, and key performance indicators (KPIs).
- BI Developer: Builds and maintains dashboards, data models, and reporting solutions using BI tools.
- Reporting Analyst: Prepares business reports, tracks performance metrics, and shares regular updates with stakeholders.
- Data Visualization Specialist: Converts complex datasets into visual reports and interactive dashboards to make information easier to understand.
- BI Consultant: Helps organizations implement BI tools, improve reporting processes, and develop data visualization strategies.
A common career progression may include BI Analyst, Senior BI Analyst, BI Lead, BI Manager, and Head of Business Intelligence, depending on the organization and specialization.
2. Careers in Business Analytics
Business Analytics careers suit people who enjoy solving business problems, identifying patterns, forecasting outcomes, and supporting strategic decisions through data. These roles involve analytical techniques, statistical methods, and business knowledge. Popular job roles include:
- Business Analytics Analyst: Examines business data to identify trends, evaluate performance, and recommend data-backed improvements.
- Business Analyst: Understands business requirements, evaluates processes, and recommends solutions to improve business operations.
- Product Analyst: Studies user behavior and product performance to identify opportunities for improvement.
- Marketing Analyst: Analyzes campaign performance, customer behavior, and marketing trends to improve marketing decisions.
- Financial Analyst: Uses financial and business data to evaluate performance, forecast outcomes, and support financial planning.
- Analytics Consultant: Helps organizations solve business problems through data analysis, analytical models, and strategic recommendations.
A common career progression may include Business Analytics Analyst, Senior Analyst, Analytics Lead, Analytics Manager, and Director of Analytics, depending on the organization and specialization.
To understand the long-term value, read our guide on whether business analytics is a good career.
Explore Business Analytics Career Guides
Business Intelligence vs Business Analytics: Future Scope
The future looks bright for both fields. As companies collect more data and adopt AI, the demand for people who can read and use data keeps growing. Here is what the latest 2026 market research says about each one.
1. Future Scope of Business Intelligence
- Steady market growth: According to Fortune Business Insights, the global BI market is projected to grow from USD 37.96 billion in 2026 to USD 72.21 billion by 2034, at a CAGR of 8.40%.
- Shift to the cloud: Cloud-based BI is expected to hold 50.55% of the market in 2026, as companies move away from old on-premises systems.
- AI inside BI tools: BI platforms are adding AI features like natural language queries and automated insights, so BI professionals who use these features will stand out.
- What it means for students: Learning cloud BI tools like Power BI and Looker, along with AI-powered reporting, will add strong value to your profile.
2. Future Scope of Business Analytics
- Fast market growth: According to IMARC Group, the global business analytics market reached USD 104.1 billion in 2025 and is expected to reach USD 203.4 billion by 2034, growing at a CAGR of 7.49% from 2026 to 2034.
- Predictive analytics is growing fastest: According to Mordor Intelligence, the business analytics market is estimated at USD 98.84 billion in 2026 and could reach USD 149.47 billion by 2031. Descriptive analytics still holds the largest share, but predictive techniques are growing faster than every other category.
- Wider adoption: Companies of all sizes, including small and medium businesses, are now investing in analytics, which opens up more job opportunities.
- What it means for students: Skills like forecasting, statistics, and predictive modeling will matter more each year, making BA a strong long-term career choice.
Want to know where the field is heading next? Read our detailed blog on the future of business analytics.
Business Intelligence vs Business Analytics: Which Is Better to Learn?
Choosing between business intelligence and business analytics depends on your interests, career goals, and the type of work you want to pursue. BI is a good starting point if you enjoy working with dashboards, reports, and performance metrics.
Business analytics may be more suitable if you want to investigate business problems, identify patterns, and work with statistical analysis and forecasting. Both fields offer opportunities for students interested in building data-related careers.
Here is how to decide:
- Choose BI if you enjoy building dashboards, working with visuals, and want a beginner-friendly entry into data jobs.
- Choose BA if you enjoy math, solving puzzles, asking "why," and want to influence business strategy.
- Choose BI if you prefer structured work with clear daily tasks like reporting and KPI tracking.
- Choose BA if you want higher salary growth at senior levels and a path toward leadership or product roles.
- Start with BI skills like Excel, SQL, and Power BI, because they are needed in both fields.
- Move into BA by adding statistics, Python, and forecasting once you are comfortable with the basics.
- Remember that the lines are blurring. Modern tools like Power BI now include AI and forecasting features, so learning both gives you the strongest profile.
Recommended Professional Certificates
Data Analytics Course with Gen AI
Data Science Course with Internship & Placement Support
How to Start a Career in BI or BA: Step-by-Step Roadmap
If you are a student or beginner looking to enter either field, you do not need to learn everything at once. Follow this simple step-by-step roadmap to build your skills:
- Step 1: Master the basics (Month 1): Start with Microsoft Excel and SQL. Learn how to clean data, use pivot tables, and write basic queries to pull data from databases.
- Step 2: Learn a visualization tool (Month 2): Pick one popular BI tool like Power BI or Tableau. Practice connecting datasets and building clean, easy-to-read dashboards.
- Step 3: Add analytics and statistics (Month 3): If you want to move toward business analytics, learn basic statistics, forecasting, and Python or R for deeper data analysis.
- Step 4: Build real-world projects (Month 4): Create 2 to 3 portfolio projects using real business datasets, such as sales tracking, customer churn, or retail inventory analysis.
- Step 5: Apply for entry-level roles: Start applying for roles like Junior BI Analyst, Reporting Analyst, or Business Analyst, and highlight your projects on your resume and LinkedIn.
FAQs About Business Intelligence vs Business Analytics
Business intelligence focuses on collecting, organizing, and presenting business data through reports and dashboards to monitor performance. Business analytics uses analytical techniques to investigate patterns, understand business problems, and support better decisions. Both disciplines overlap and use many of the same tools.
Yes, many experts see BI as a part of the wider analytics world. BI covers descriptive analytics, while business analytics also covers diagnostic, predictive, and prescriptive analytics. In practice, BI is the base that BA builds on.
BI is generally easier to learn because it focuses on reporting and visualization tools. Business analytics needs stronger knowledge of statistics, data modeling, and sometimes programming in Python or R.
Yes, freshers can get BI analyst or junior BI developer roles. Strong skills in Excel, SQL, and Power BI or Tableau, along with a few dashboard projects in your portfolio, can help you land your first job.
No, you need SQL for most BI jobs, but heavy programming is usually not required. Tools like Power BI and Tableau use drag-and-drop features, though learning DAX or basic Python can help you grow faster.
No, machine learning is not a standard requirement for most Business Analyst roles, which primarily involve understanding business requirements, processes, and stakeholder needs. However, Business Analytics professionals working in advanced analytics or predictive modeling may benefit from machine learning knowledge.
Yes. Many professionals come from commerce, arts, or management backgrounds. You can start by learning Excel, SQL, and a visualization tool, then slowly add statistics and analytics skills.
A BI developer designs data models, builds data pipelines, and creates dashboards and reports. They make sure business users get accurate and timely data through BI tools.
Power BI is mainly a business intelligence tool used for dashboards and reports. However, it also offers forecasting and AI features, so it supports basic business analytics tasks too.
IT services, banking and finance, e-commerce, consulting, healthcare, and manufacturing hire the most. Global capability centers in cities like Bangalore, Hyderabad, and Pune are also big recruiters.
Yes. BI professionals can move into business analytics roles by developing additional skills in statistics, analytical modeling, Python, and forecasting. Their existing experience with SQL, Excel, and data visualization provides a useful foundation for this transition.
With regular practice, you can learn the basics of BI in about 3 to 4 months. This includes Excel, SQL, and one tool like Power BI or Tableau, plus a few hands-on projects.
A bachelor's degree in any field like commerce, engineering, science, or management is usually enough to start. Practical skills, certifications, and real projects matter more to employers than a specific degree.
No, AI is changing these jobs, not removing them. It automates repetitive work like report building and data cleaning, so professionals can focus on understanding problems, explaining insights, and guiding decisions.
A BI dashboard shows current numbers and trends, like daily sales or website traffic. A business analytics report goes deeper, explaining the reasons behind those numbers and suggesting what to do next.
For BI, the Microsoft Power BI Data Analyst certification (PL-300) and Tableau certifications are popular. For BA, certifications like CBAP and PMI-PBA, along with a practical business analytics course, can help you stand out.
Yes. Affordable cloud tools have made BI and BA easy for small and medium businesses. They use them to track sales, understand customers, and plan stock without needing a large data team.
Yes. Business intelligence and business analytics share foundational skills such as Excel, SQL, data visualization, and data interpretation. You can develop these skills together and gradually learn advanced concepts like statistics, forecasting, and predictive modeling.
Conclusion
Business intelligence and business analytics both help organizations make better decisions using data. While BI primarily focuses on monitoring performance through reports and dashboards, BA uses analytical techniques to investigate business problems, identify patterns, and support future decisions. Although their objectives differ, both disciplines share tools, skills, and practical applications across industries.
For students interested in building a career in this field, learning Excel, SQL, Power BI, statistics, and analytical problem-solving is a good starting point. Working on real-world projects can further help you understand how businesses use data to make decisions. A structured online Business Analytics course can help you develop these skills and prepare for relevant entry-level opportunities.

Build Job-Ready Skills with Our Online Courses
Join Our On-Campus Data-Related Programs
| Data Analytics Course in Jaipur | Data Analytics Course in Jodhpur |
| Data Science Course in Jaipur | Data Science Course in Jodhpur |
Explore Our Free Courses




Leave a comment
Your email address will not be published. Required fields are marked *Comments (0)
No comments yet.