
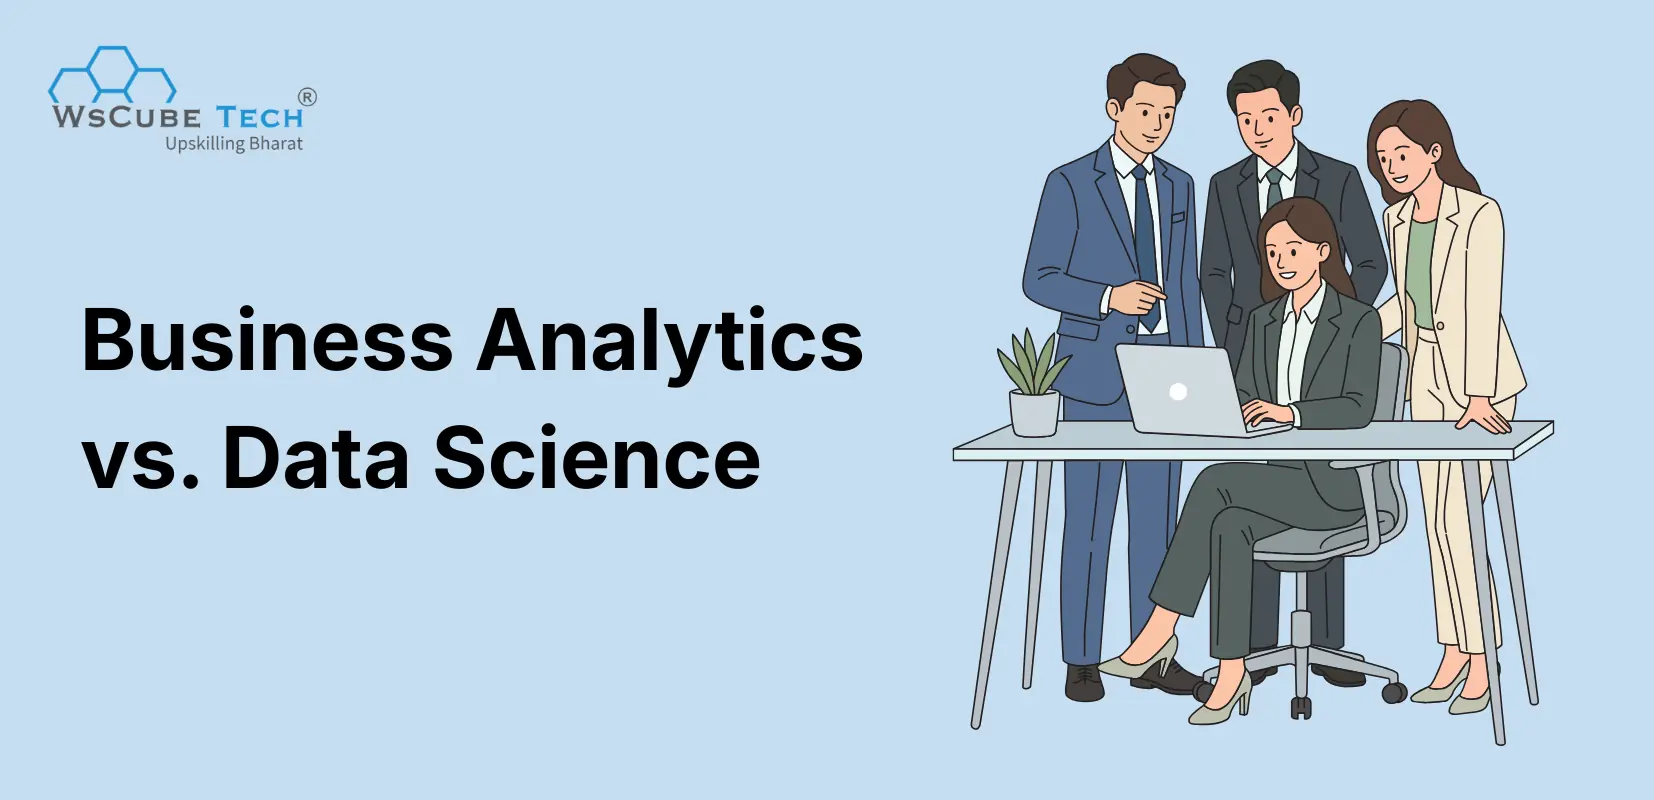
Business analytics and data science both use data to solve problems, but they focus on different goals. Business analytics helps businesses understand performance and make better decisions, while data science uses statistics, programming, and machine learning to uncover patterns and predict future outcomes.
If you're confused about business analytics vs data science, in this guide, you will learn the key differences, skills, tools, salaries in India, career paths, and how to decide which field suits you best.
Key Takeaways
- Business analytics explains what happened and why; data science predicts what will happen next.
- Business analysts build reports and dashboards, while data scientists build predictive models.
- Business analytics needs Excel, SQL, and BI tools; data science needs Python, statistics, and machine learning.
- Business analytics needs less coding, which makes it easier for non-technical students to start.
- Business analytics leads to roles like business analyst, BI analyst, and product analyst.
- Data science leads to roles like data scientist, ML engineer, and AI engineer.
- AI will automate routine tasks in both fields but is unlikely to replace either role.
- Choose business analytics if you enjoy business problems, and data science if you enjoy coding and math.
Business Analytics vs Data Science: A Quick Comparison
Before going deeper, here is a side-by-side view of data science vs business analytics to help students and job seekers understand the differences.
| Factor | Business Analytics | Data Science |
| Main objective | Improve business decisions using data | Discover patterns and predict outcomes using data |
| Typical questions | Why did sales drop last quarter? Which region performs best? | Which customers are likely to leave next month? What will demand look like? |
| Methods | Descriptive and diagnostic analysis, KPIs, reporting, basic forecasting | Statistical modeling, machine learning, deep learning, experimentation |
| Programming | Low to moderate (SQL, some Python or R) | High (Python, SQL, R, ML libraries) |
| Common tools | Excel, SQL, Power BI, Tableau, Looker | Python, Jupyter, scikit-learn, TensorFlow, PyTorch, Spark |
| Data type | Mostly structured data from business systems | Structured and unstructured data (text, images, logs) |
| Outputs | Dashboards, reports, presentations, recommendations | Predictive models, algorithms, data products |
| Job roles | Business Analyst, BI Analyst, Product Analyst, Operations Analyst | Data Scientist, ML Engineer, NLP Engineer, AI Researcher |
Recommended Professional Certificates
Data Analytics Course with Gen AI
Data Science Course with Internship & Placement Support
What Is Business Analytics?
Business analytics is the practice of using data to understand business performance and make better decisions. It sits close to managers and decision-makers. It is the process of collecting, analyzing, and interpreting business data to answer practical questions and improve results. Its main goal is simple: help a company decide what to do next, whether that means cutting costs, improving a product, or targeting the right customers.
Key activities and business decisions it supports
A business analyst usually:
- Collects data from sales, finance, marketing, and operations systems
- Cleans and organizes data in Excel or SQL
- Tracks key performance indicators (KPIs) such as revenue, conversion rate, and churn
- Builds dashboards in tools like Power BI or Tableau
- Finds the reasons behind trends and problems
- Presents findings and recommendations to managers
These insights support decisions like pricing changes, budget planning, inventory planning, marketing spend, and process improvements.
Simple real-world example
Imagine an online clothing store seeing a 15% drop in sales in one month. A business analyst checks the data and finds that most of the drop came from mobile users in two cities after a checkout page update. The analyst shares this with the product team, who fix the page, and sales recover. That is business analytics in action: finding the problem and guiding the fix.
What Is Data Science?
Data science goes a step further. It uses advanced math and programming to find hidden patterns and make predictions that humans cannot easily spot. It is a field that combines statistics, programming, and domain knowledge to extract insights from data and build models that predict future outcomes. Its main goal is to create systems that learn from data and can make or support decisions automatically.
Key activities and predictive or analytical methods
A data scientist usually:
- Collects and cleans large and messy datasets
- Explores data to find patterns and relationships
- Builds machine learning models such as regression, classification, and clustering
- Works with unstructured data like text, images, or audio
- Tests and improves models for accuracy
- Works with engineers to put models into real products
Common methods include predictive modeling, natural language processing, recommendation systems, time series forecasting, and A/B testing.
Simple real-world example
Think about how a streaming app suggests shows you might like. A data scientist builds a recommendation model that studies what millions of users watch, how long they watch, and what they skip. The model then predicts what each user is likely to enjoy next. This is data science in practice: using user behavior data and machine learning to generate personalized recommendations.
Business Analytics vs Data Science: 7 Key Differences
The difference between business analytics and data science becomes clear when you look at their goals, methods, and daily work. Here are seven key areas where they differ.
1. Objectives and Business Problems
- Business analytics focuses on solving known business problems. The questions are usually clear, such as "Why are costs rising?" or "Which product line is most profitable?"
- Data science often deals with open-ended problems. The question may be "Can we predict which machines will fail?" or "Can we detect fraud in real time?" The answer may require building something entirely new.
2. Approach and Analytical Methods
- Business analytics mainly uses descriptive analytics (what happened) and diagnostic analytics (why it happened). It may also use simple forecasting and what-if analysis.
- Data science leans on predictive analytics (what will happen) and sometimes prescriptive analytics (what should we do). It uses machine learning, statistical modeling, and experiments to reach these answers.
3. Programming Requirements
- In business analytics, SQL and Excel are often enough to start. Some roles ask for basic Python or R for deeper analysis, but heavy coding is rare.
- In data science, coding is a core part of the job. You need strong Python skills, comfort with libraries like Pandas, NumPy, and scikit-learn, and good SQL. Many roles also expect knowledge of version control (Git) and cloud platforms.
4. Education and Qualifications Required
- Business analysts come from many backgrounds, including commerce, BBA, MBA, economics, engineering, and even arts. Employers value business understanding and analytical thinking as much as technical skills.
- Data scientists usually have degrees in computer science, statistics, mathematics, engineering, or related fields. Many senior roles prefer a master's degree. Still, skilled candidates with strong portfolios can enter without these degrees.
5. Deliverables and Business Impact
- Business analysts deliver dashboards, reports, presentations, and clear recommendations. Their impact shows up in faster, better-informed decisions by managers.
- Data scientists deliver models, algorithms, and data products. Their impact often shows up inside the product itself, such as a fraud filter, a recommendation engine, or a demand forecast that runs every day.
6. Type and Volume of Data
- Business analysts mostly work with structured data stored in databases, spreadsheets, and CRM or ERP systems. The data is usually clean enough to analyze with SQL and BI tools.
- Data scientists work with both structured and unstructured data, often at very large scale. This can include customer reviews, sensor readings, images, and app logs that need heavy cleaning before use.
7. Stakeholders and Daily Work
- Business analysts spend a lot of time with managers, sales teams, and operations teams. Communication, meetings, and storytelling with data are a big part of their day.
- Data scientists spend more time on research, coding, and testing. They work closely with data engineers, software developers, and product teams to build and deploy their models.
Explore More Blogs Related to Business Analytics
Skills Required for Business Analytics vs Data Science
Both fields share a base of data skills, but the depth and focus differ. The table below compares the key business analytics vs data science skills you need for each.
| Skill Area | Business Analytics | Data Science |
| Excel | Advanced (pivot tables, lookups, formulas) | Basic to moderate |
| SQL | Strong, used daily | Strong, used daily |
| Programming | Basic Python or R (helpful, not always required) | Advanced Python, often R |
| Statistics | Descriptive statistics, basic hypothesis testing | Advanced statistics, probability, inferential methods |
| Mathematics | Business math, basic algebra | Linear algebra, calculus, probability |
| Machine learning | Awareness of basics | Deep knowledge of ML algorithms and model tuning |
| Data visualization | Strong (Power BI, Tableau) | Moderate (Matplotlib, Seaborn, Plotly) |
| Business knowledge | Very strong domain and process understanding | Moderate, grows with experience |
| Communication | Very strong, presenting to leadership | Strong, explaining models to non-technical teams |
| Big data and cloud | Rarely needed | Often needed (Spark, AWS, GCP, Azure) |
Want a detailed breakdown? Read our guides on business analyst skills and data science skills.
Tools Used in Business Analytics vs Data Science
The tools each field uses reflect its goals. Business analytics tools focus on reporting and visualization, while data science tools focus on coding and modeling.
| Category | Business Analytics Tools | Data Science Tools |
| Spreadsheets | Microsoft Excel, Google Sheets | Excel (for quick checks) |
| Databases and querying | SQL, MySQL, PostgreSQL, BigQuery | SQL, PostgreSQL, MongoDB, BigQuery |
| Visualization and BI | Power BI, Tableau, Looker, Qlik | Matplotlib, Seaborn, Plotly, Tableau |
| Programming | Python (Pandas), R (optional) | Python, R, Jupyter Notebook |
| Machine learning | Built-in forecasting in BI tools | scikit-learn, TensorFlow, PyTorch, XGBoost |
| Big data | Rarely used | Apache Spark, Hadoop, Databricks |
| Cloud platforms | Power BI Service, Google Data Studio (Looker Studio) | AWS SageMaker, Google Vertex AI, Azure ML |
| Collaboration | Jira, Confluence, PowerPoint | Git, GitHub, Docker |
Explore more in our complete lists of data science tools and business analytics tools.
Business Analytics vs Data Science Salary in India (2026)
Salaries in business analytics and data science vary by experience, technical expertise, industry, and location. Comparing salary ranges across career stages helps you understand each field's earning potential in India.
Business Analyst Salary in India by Experience
Business analyst salaries typically increase with experience, industry knowledge, and the ability to translate data into business decisions.
- Freshers (0–2 years): ₹4-7 LPA.
- Mid-level professionals (2–5 years): ₹8-14 LPA.
- Senior professionals (5–8 years): ₹15-22 LPA.
- Lead or principal roles (8+ years): ₹22-35 LPA or more.
- Higher-paying locations: Bangalore, Hyderabad, and Chennai, with reported salary ranges of approximately ₹10-11.1 LPA, ₹10-11 LPA, and ₹9.9-11 LPA, respectively.
For a detailed breakdown by experience, company, and location, read our guide to business analyst salary in India.
Data Scientist Salary in India by Experience
Data scientists can earn competitive salaries as they develop expertise in programming, statistical analysis, machine learning, and predictive modeling.
- Freshers (0–2 years): ₹4-8 LPA.
- Mid-level professionals (2–5 years): ₹8-18 LPA.
- Senior professionals (5+ years): ₹20-30 LPA or more.
- Technical or data science leads (10+ years): ₹25-50 LPA or more.
- Higher-paying locations: Bangalore, Delhi, and Mumbai, with reported ranges of approximately ₹15.4-17 LPA, ₹15.4-17 LPA, and ₹15.2-16.8 LPA, respectively.
For more details on salary progression, top-paying companies, and location-wise estimates, read our guide to data scientist salary in India.
Business Analytics vs Data Science: Career Opportunities
Both fields offer strong and varied career opportunities, but the roles and growth paths look different. Here is what each path usually looks like.
Business Analytics Career Paths and Job Roles
Business analytics careers often start with entry-level analyst roles and grow toward strategy and leadership. Common job roles include:
- Junior Business Analyst / Data Analyst: Prepares reports, cleans data, and tracks KPIs.
- Business Analyst: Gathers requirements, analyzes problems, and recommends solutions.
- BI Analyst / BI Developer: Builds dashboards and reporting systems.
- Product Analyst: Studies how users interact with a product and suggests improvements.
- Operations or Financial Analyst: Focuses on costs, efficiency, and planning.
- Senior Business Analyst / Analytics Manager: Leads teams and drives business strategy.
Over time, many business analysts move into product management, consulting, or strategy roles. Plan your growth with our guide on the business analyst career path.
Data Science Career Paths and Job Roles
Data science careers usually begin with technical roles and grow toward specialized or leadership positions. Common job roles include:
- Junior Data Scientist / Associate Data Scientist: Cleans data and builds basic models.
- Data Scientist: Designs, trains, and tests predictive models.
- Machine Learning Engineer: Puts models into production and keeps them running.
- NLP Engineer or Computer Vision Engineer: Specializes in text or image data.
- AI Engineer: Builds applications using large language models and generative AI.
- Senior or Lead Data Scientist / Head of Data Science: Leads teams and sets the data strategy.
Some data scientists also move into research, AI product management, or data engineering. Learn more about the journey in our guide on data science career.
Business Analytics vs Data Science Demand in India
Both business analytics and data science offer career opportunities in India as organizations increasingly rely on data to improve decision-making, understand business performance, and solve complex problems. However, the nature of opportunities differs based on business needs, technical requirements, and industry applications.
Demand for Business Analytics
- Cross-industry applications: Business analytics is used in sectors such as banking, IT, consulting, retail, and e-commerce to evaluate performance and support strategic decisions.
- Business-focused roles: Opportunities often involve data interpretation, reporting, trend analysis, and translating insights into actionable business recommendations.
- Varied entry requirements: Depending on the role, employers may prioritize analytical thinking, business knowledge, communication, and proficiency in tools such as Excel, SQL, or data visualization platforms.
Demand for Data Science
- Growing use of advanced analytics: Organizations use data science to identify complex patterns, develop predictive models, and support data-driven solutions.
- Technical specialization: Roles may require knowledge of statistics, programming, machine learning, and data handling, depending on the position.
- Industry-specific applications: Data science is relevant in areas such as finance, healthcare, e-commerce, technology, and other sectors that work with large or complex datasets.
Overall, demand for both fields depends on an individual's skills, experience, and the requirements of the role. The better choice is the one that aligns with your interests, strengths, and long-term career goals.
Business Analytics vs Data Science: Real-World Examples
Seeing how real companies use each field makes the difference easy to understand. Here are some well-documented examples.
Business Analytics Real-World Example
- Walmart: Stocking stores before hurricanes
When Hurricane Charley hit Florida in 2004, Walmart studied its past sales data from stores in storm-affected areas. The analysis showed that demand for some unexpected products, like strawberry Pop-Tarts, jumped sharply before hurricanes, along with obvious items like flashlights and bottled water. Walmart used these findings to stock the right products in stores ahead of later storms.
This is classic business analytics: looking at past data to understand customer behavior and make a better stocking decision.
- Starbucks: Choosing new store locations
Starbucks uses a mapping and analytics platform called Atlas to decide where to open new stores. Its teams look at trade areas, retail clusters, population data, traffic patterns, and even upcoming office buildings that could bring in new customers. Starbucks also checks where customers spend more than average on coffee to decide which stores should get its premium brewing equipment.
Here, data guides a clear business decision: where to invest in a new store.
Data Science Real-World Example
- Netflix: Personalized recommendations
Netflix uses machine learning to recommend shows and movies based on what each user watches. A 2025 study from Northwestern’s Kellogg School of Management found that replacing Netflix’s current system with a simpler, popularity-based approach would cut viewer engagement by about 12%. The study also found that most of the value comes from matching people with content they actually like.
This is data science at work: a model that learns from user behavior and predicts what each person will enjoy.
- American Express: Real-time fraud detection
American Express processes more than eight billion transactions a year. To catch fraud, it uses deep learning models that spot unusual spending patterns, such as purchases made in distant cities just minutes apart. Combining these deep learning models with its existing machine learning model improved fraud detection accuracy by up to 6% in some segments, and the system makes decisions in about two milliseconds.
Business Analytics vs Data Science: Future Scope in 2026 and Beyond
Both fields will keep changing as AI and automation grow. Here is what we can see today and what is likely to happen next.
What current evidence shows
- AI is already part of daily work. BI tools like Power BI and Tableau now include AI features that help users write queries, summarize data, and build visuals using plain language.
- Generative AI has created new roles. Many companies now hire AI engineers and data scientists who can work with large language models.
- Data skills remain in demand. Global reports such as the WEF Future of Jobs Report 2025 rank AI, big data, and analytical thinking among the top skills employers want.
What experts project
- Business analytics will likely shift from building basic reports to interpreting insights and advising leaders. Routine reporting may become more automated, so business sense, storytelling, and decision-making skills will matter more.
- Data science will likely shift from building every model from scratch to customizing, testing, and managing AI systems. Skills like MLOps, model monitoring, and responsible AI may become more valuable.
- The two fields may overlap more. Analysts will use more predictive analytics, and data scientists will need stronger business understanding.
These projections are based on current trends and could change as technology evolves. The safest approach is to build strong fundamentals and keep learning.
Upcoming Masterclass
Attend our live classes led by experienced and desiccated instructors of Wscube Tech.





Business Analytics vs Data Science: Which Is Better for You?
There is no single winner in the “business analytics vs data science which is better” debate. The right choice depends on your interests, strengths, and career goals.
Choose Business Analytics If…
- You enjoy solving business problems more than writing code.
- You like working with people, presenting ideas, and influencing decisions.
- You come from a commerce, management, or non-technical background.
- You want to enter the job market quickly with skills like Excel, SQL, and Power BI.
- You see yourself moving into product management, consulting, or strategy later.
Choose Data Science If…
- You enjoy math, statistics, and programming.
- You like building things and solving complex technical problems.
- You are curious about machine learning and AI.
- You are willing to spend more time learning before your first job.
- You want to work on products like recommendation systems, chatbots, or fraud detection.
Business Analytics vs Data Science: Which Is Better for Beginners and Non-Technical Students?
Short answer: Business analytics is the better starting point for most beginners and non-technical students.
Here is why:
- Less coding: You can start with Excel, SQL, and Power BI. Python can come later.
- Easier learning curve: You can learn the basics in a few months, without advanced math.
- More entry-level jobs: Almost every industry hires business analysts, so fresher roles are easier to find.
- Open to all backgrounds: Students from commerce, BBA, MBA, economics, and arts can enter the field easily.
When data science is the better choice:
- You already enjoy coding, math, and statistics.
- You are ready to spend more time learning before your first job.
- You want to work on machine learning and AI products.
A smart path for many students: Start in business or data analytics, gain real work experience, and then move into data science if the technical side excites you. Both careers pay well and grow over time, so choose the one that matches the work you would enjoy doing every day.
How to Start a Career in Business Analytics or Data Science
The first steps for both careers are similar: learn the basics, practice with real data, and build a portfolio. Here is a simple roadmap for each.
How to Start a Career in Business Analytics
- Learn the foundations: Start with Excel (formulas, pivot tables, charts) and basic statistics.
- Master SQL: Learn to query, filter, join, and summarize data from databases.
- Learn a BI tool: Pick Power BI or Tableau and build interactive dashboards.
- Understand business basics: Learn how KPIs, finance, marketing, and operations work.
- Build projects: Create dashboards on sales, HR, or customer data and explain your findings.
- Create a portfolio: Share your work on GitHub, LinkedIn, or a personal website.
- Apply for entry-level roles: Look for jobs like Junior Business Analyst, Data Analyst, MIS Analyst, or Reporting Analyst.
Learn how to start a career in business analytics in detail with our beginner-friendly guide.
How to Start a Career in Data Science
- Build math and statistics skills: Learn probability, statistics, and basic linear algebra.
- Learn Python: Get comfortable with Pandas, NumPy, Matplotlib, and Jupyter Notebook.
- Learn SQL: Practice working with real databases.
- Study machine learning: Learn regression, classification, clustering, and model evaluation using scikit-learn.
- Explore advanced topics: Try deep learning, NLP, or generative AI once you know the basics.
- Build projects: Work on problems like churn prediction, price prediction, or sentiment analysis using public datasets from sites like Kaggle.
- Create a portfolio: Upload code to GitHub and write short explanations of your projects.
- Apply for entry-level roles: Look for jobs like Junior Data Scientist, Data Analyst, ML Intern, or Associate Data Scientist.
A structured business analytics course with mentorship and live projects can help you move faster in either field.
Read our detailed guide on How to Learn Data Science for a step-by-step learning roadmap.

FAQs About Business Analytics and Data Science
Business analytics uses data to explain business performance and guide decisions. Data science uses statistics, programming, and machine learning to find patterns and predict future outcomes. In short, business analytics focuses on decisions, while data science focuses on predictions and models.
Business analytics is often seen as a related field that overlaps with data science. Both use data analysis, but business analytics applies it to business decisions, while data science covers a wider range of methods, including machine learning and AI.
Yes. In many companies, data scientists build predictive models and business analysts turn those predictions into business actions. Using both together gives companies deeper insights and better decisions.
Yes. Many business analysts come from commerce, management, or arts backgrounds. You can start with Excel, SQL, and Power BI, which are beginner-friendly and do not need advanced coding.
Yes, many data scientists come from math, statistics, engineering, economics, or other fields. What matters most is strong skills in Python, statistics, and machine learning, along with a solid project portfolio.
Python is essential for data science. For business analytics, it is helpful but not always required at the start, since Excel, SQL, and BI tools cover most entry-level tasks.
SQL is a great starting point, but it works best when combined with Excel and a BI tool like Power BI or Tableau. Good communication and business understanding will also help you stand out.
With regular practice, you can learn the basics of business analytics in about 4 to 6 months. Data science usually takes 8 to 12 months or more because it involves programming, statistics, and machine learning.
Business analytics generally has more entry-level openings in India because almost every company needs analysts. Data science roles are fewer at the fresher level but often pay more.
Business analytics is usually easier to get into because it needs less coding and math. Data science requires a stronger technical foundation and more preparation.
Yes, it is a common career move. Business analysts already know SQL and data analysis, so they can add Python, statistics, and machine learning to make the switch.
Yes. Data scientists have strong technical skills, so they can move into analytics or strategy roles by building stronger business knowledge and communication skills.
Both are hired across IT, banking, fintech, ecommerce, retail, healthcare, telecom, consulting, and manufacturing. Tech product companies and AI startups hire data scientists more actively.
For business analytics, try sales dashboards, HR attrition analysis, or marketing campaign reports. For data science, try churn prediction, house price prediction, or sentiment analysis of reviews.
Business intelligence focuses on reporting what happened using dashboards. Data analytics is the broad process of analyzing data for insights. Business analytics uses analytics to solve business problems and guide future decisions.
Sometimes, yes. Both may use the same company data, but business analysts usually work with structured data for reports, while data scientists may also use large unstructured data like text or images for modeling.
AI is more likely to change these roles than replace them. It can automate routine reports and coding tasks, but companies still need people who understand the business, ask the right questions, and judge results.
Both offer strong long-term growth. Data science often has higher salary potential in technical roles, while business analytics offers a clear path to management, product, and strategy roles. The better choice depends on your interests and strengths.
Build Job-Ready Skills with Our Online Courses
Join Our On-Campus Data-Related Programs
| Data Analytics Course in Jaipur | Data Analytics Course in Jodhpur |
| Data Science Course in Jaipur | Data Science Course in Jodhpur |
Explore Our Free Courses


Leave a comment
Your email address will not be published. Required fields are marked *Comments (0)
No comments yet.