
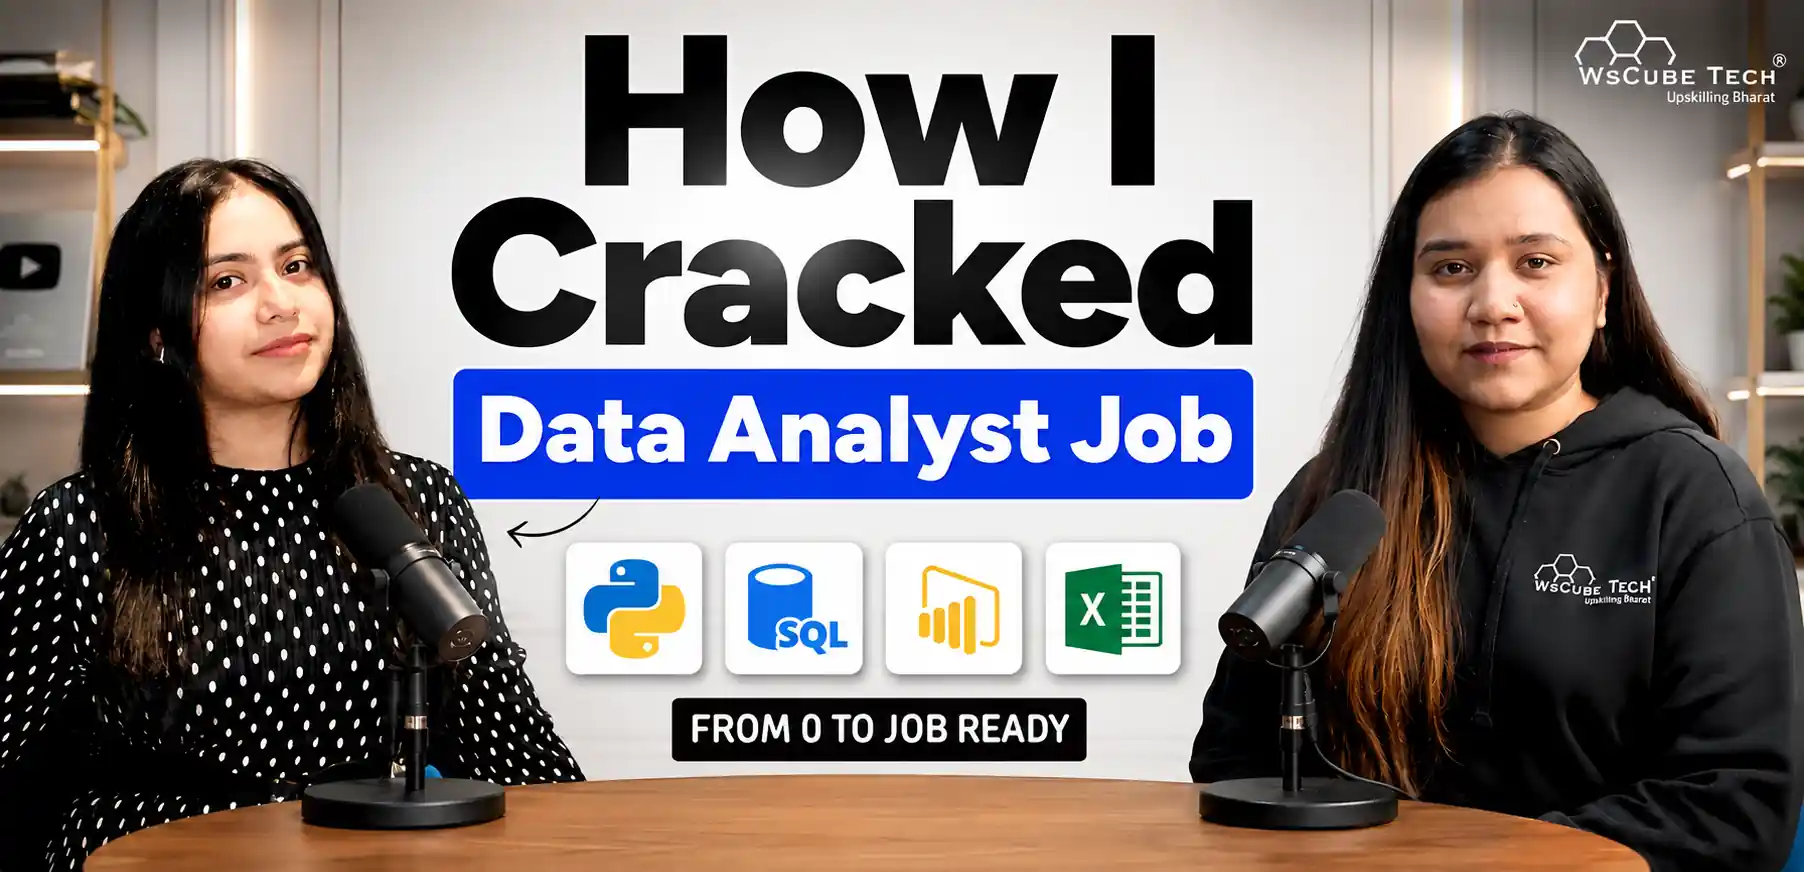
Nandini Athwani, a learner from the WsCube Tech Data Analytics Course, transitioned from a pharmacy background to a career in data analytics, landing her first role as an Operations Analyst at Stockverse, a US-based stock trading company, just months after completing the program.
In this in-depth interview, she shares her career switch, learning routine, projects, interview experience, the tools that helped her get hired, how she uses AI in her day-to-day work, and her advice for freshers starting a career in Data Analytics.
Key Highlights of the Interview
In this interview, Nandini shared her journey related to:
- Career switch: Biology to Pharmacy to Data Analytics to Operations Analyst
- First interview, first offer: This was Nandini’s first-ever interview, and she got selected.
- Role: Operations Analyst supporting a 20-person sales team at a US stock trading firm.
- Core tools: Advanced Excel, SQL, Power BI, Python, and AI.
- Daily work: Mostly data cleaning, organizing large sales/enrollment/payment datasets, and building Power BI dashboards.
- Interview focus: Excel case tasks, basic Power BI questions, and strong communication.
- AI at work: Uses AI to generate query logic, understand APIs, and speed up dashboard work.
- Advice: Be consistent, focus on projects, and don’t fear starting from zero.
Watch the Full Interview
What does Nandini’s journey from Pharmacy to Data Analytics really look like? Watch her full interview to find out.
Student Highlight
| Attribute | Details |
| Name | Nandini Athwani |
| Course | Data Analysis Course |
| Background | Biology student (switched to Pharmacy) |
| Current Role | Operations Analyst |
| Company | Stockverse (US-based stock trading company) |
| Key Tools | Advanced Excel, SQL, Power BI, Python, AI |
| Work Focus | Data cleaning, reporting, dashboards for a 20-person sales team |
| Interview Outcome | First interview (selected as Operations Analyst) |
Nandini’s Background: Why a Pharma Student Chose Analytics
Nandini started as a biology student and later moved into pharmacy. While exploring career options, she realized that staying only in pharma might limit her growth in an increasingly AI-driven job market. She noticed that fields like clinical research already handle large datasets, and she wanted a role where she could work directly with data and visualization. That’s when data analytics clicked as the right path.
Recommended Professional Certificates
Data Analytics Course with Gen AI
Data Science Course with Internship & Placement Support
Nandini's Reasons for Choosing Data Analytics and WsCube Tech
Nandini chose data analytics because:
- It’s a high-growth, high-paying field with strong future demand.
- It connects with her domain knowledge (pharma/clinical research deals with data).
- She genuinely enjoys visualizing data and turning raw numbers into insights.
She joined WsCube Tech’s Data Analysis Course to get structured, beginner-to-advanced training in:
- Advanced Excel
- SQL
- Power BI
- Python and AI
Coming from a non-tech background, she appreciated the step-by-step path from basics to advanced topics.
Skills and Tools She Worked On
During her 5‑month program, Nandini focused on:
- Advanced Excel: Data cleaning, complex formulas, charts, basic forecasting.
- SQL: Querying, filtering, and transforming data efficiently.
- Power BI: Building interactive dashboards, choosing the right charts, adding filters/dropdowns.
- Python: From basics to advanced, though she found this the most challenging.
- AI: Using prompts to generate logic, understand APIs, and speed up analysis tasks.
She put extra focus on SQL, as it made her data cleaning and extraction much faster.
No Tech Background? Start Exactly Where Nandini Started
Nandini came from Biology and Pharmacy. She had never written a formula in Excel or a query in SQL before joining.
The Data Analytics Course at WsCube Tech teaches every tool from the very basics, which is exactly why the switch worked for her.
What the 18-week program includes:
- 106+ hours of live classes across 5 milestones, starting from Excel basics
- The full toolkit: Advanced Excel, MySQL, Power BI, Tableau, Python and Pandas
- AI built into every module, including prompt engineering, AI assisted SQL, and automation with n8n and Make.com
- 10 projects and case studies on real company data from Amazon, Swiggy, Myntra, Tata Power and Apollo
- Mentors from Microsoft, Amazon, Google, KPMG and Rapido
- A 4-week internship as a Data Analytics Intern at WsCube Tech
- Bonus modules in statistics, machine learning, Microsoft Fabric and Google Analytics 4
No coding background needed. You start from zero and build up, the same way Nandini did.
Experience: From Learning to Real Work
Nandini completed around 6 to 8 course projects, mostly in Excel and Power BI, and submitted them on time. These projects gave her:
- Real-world context for messy datasets
- Confidence to explain her work in interviews
- A portfolio she could reference when interviewers asked about projects
She says projects were especially important for her because she was shifting from a medical/pharma background into IT, and they helped her prove she could handle real data tasks.
Responsibilities of Nandini as an Operations Analyst
At Stockverse, a US-based stock trading company, Nandini supports a 20-person sales team. Her key responsibilities include:
- Data cleaning & organization: Handling large, messy sales, enrollment, and payment datasets.
- Reporting: Preparing weekly and monthly performance reports using advanced Excel and Power BI.
- Dashboards: Building Power BI dashboards to visualize sales performance, conversions, and top performers.
- Tracking & insights: Monitoring conversions, identifying top performers, and highlighting trends for leadership.
Most of her day goes into data cleaning and structuring; dashboarding and meetings happen on a weekly/monthly cadence.
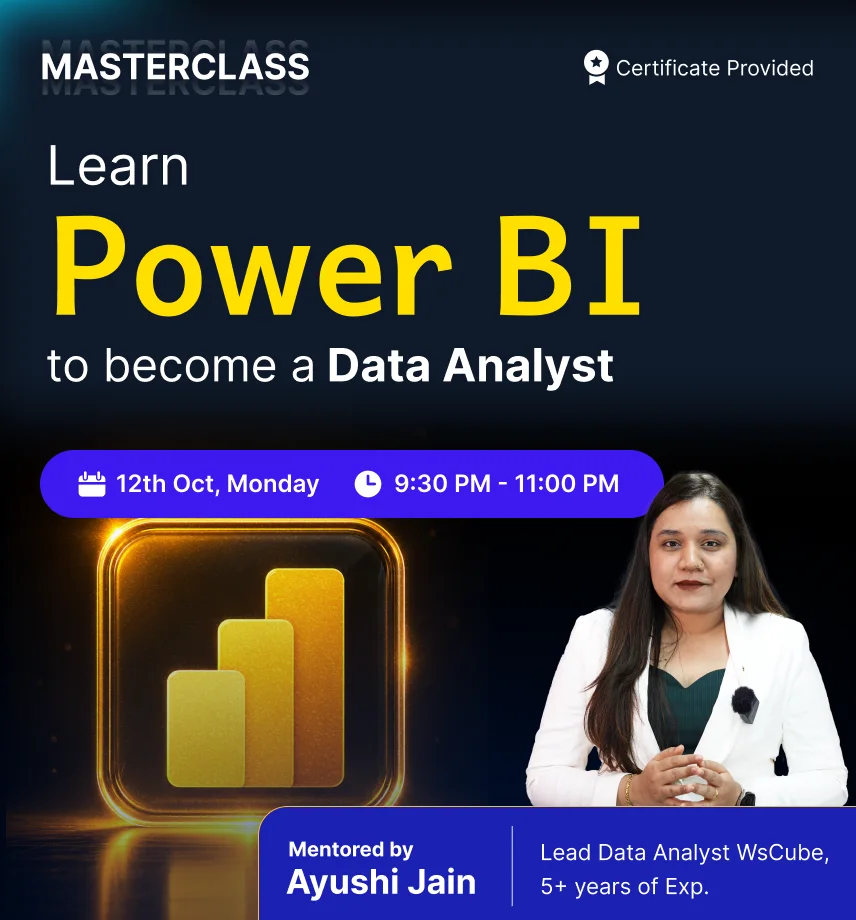
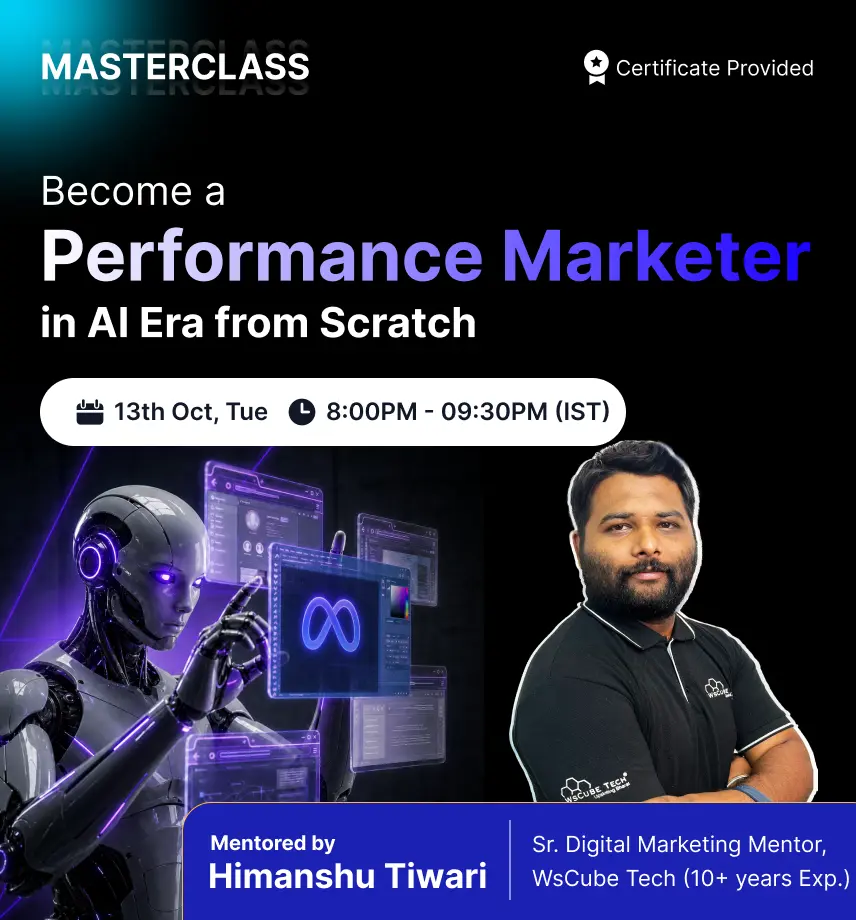
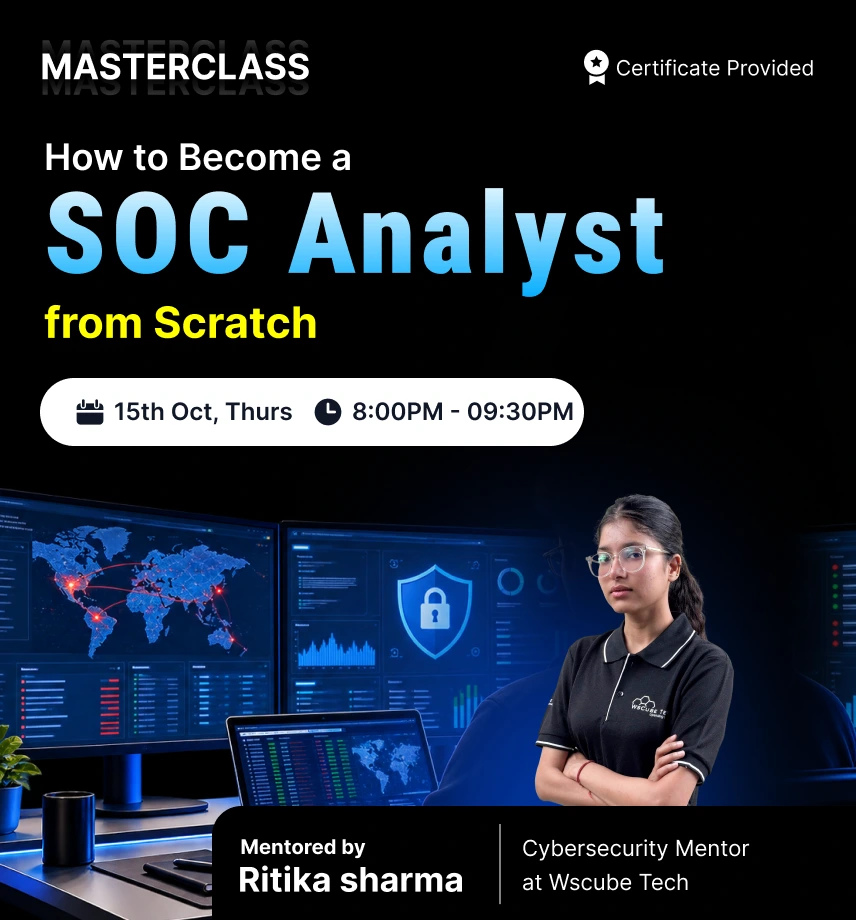
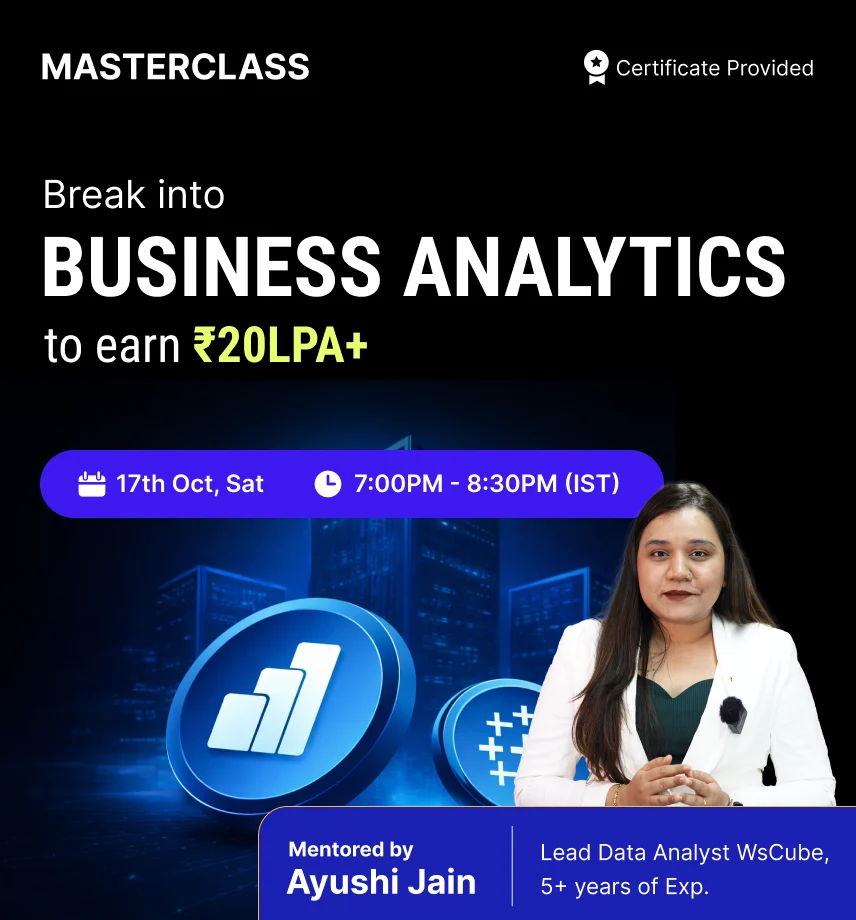
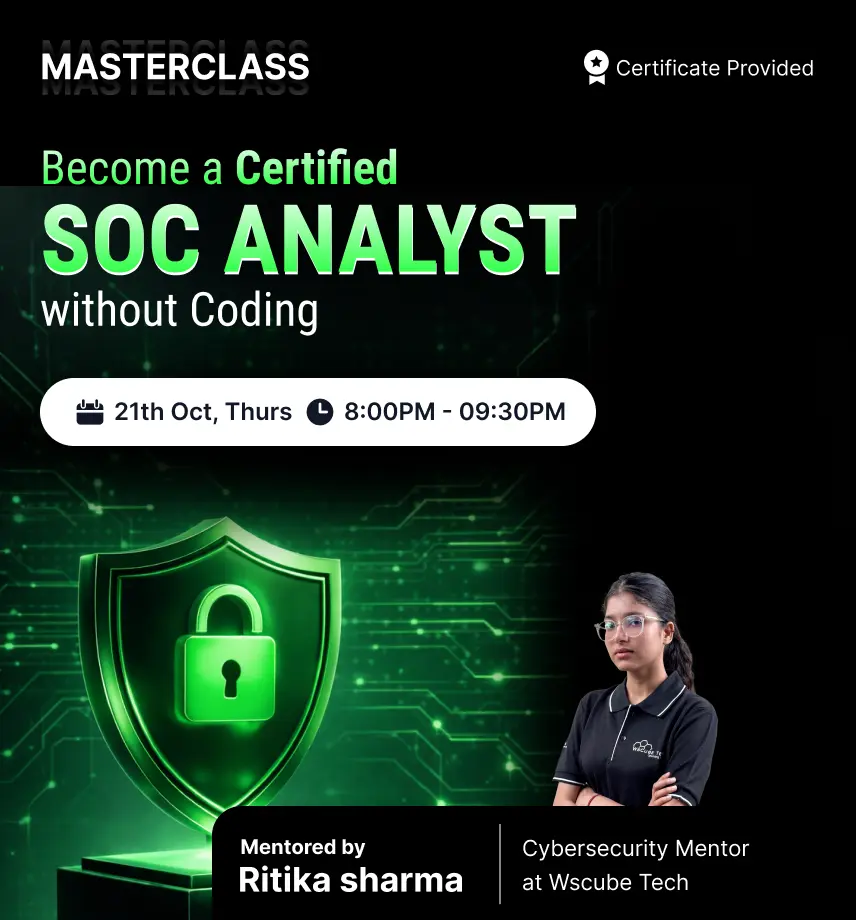
Upcoming Masterclass
Attend our live classes led by experienced and desiccated instructors of Wscube Tech.
Interview Process
This was Nandini’s first-ever interview, and she got selected as an Operations Analyst.
- Application: She applied widely on LinkedIn and Indeed, built a strong profile, and received a walk-in interview call from Stockverse.
- Mindset: She was nervous at first, but mentors helped her prepare and stay calm. She emphasizes that confidence and clear communication matter a lot, even if you don’t know every answer.
1. Technical Round (Excel)
She faced case-style Excel tasks such as:
- Splitting salesperson data and extracting key metrics
- Using advanced formulas (e.g., nested IFs, lookups, copy/paste patterns)
- Applying conditional formatting and building charts
- Discussing simple forecasts: “If sales continue at this speed, what happens in the next year?”
2. Power BI Round
Interviewers asked basics like:
- “How do you create a dashboard?”
- Which charts to use for specific metrics
- How to add dropdowns/filters to make a dashboard interactive
3. Communication
Nandini estimates that communication skills account for 50–55% of interview success. Being able to explain her thinking clearly, even while solving tasks, made a big difference.
How Nandini Leveraged AI in Operations Analytics
As a fresher, Nandini is still learning AI from more experienced colleagues, but she already uses it to:
- Generate queries and logic for dashboards via prompts
- Understand API-related tasks at a basic level
- Speed up repetitive analysis and reporting work
She sees AI as a productivity booster and plans to deepen her AI skills over time.
Her Learning Path
Nandini’s learning journey looked like this:
- Course duration: Around 5 months of structured training.
- Daily study: About 1–1.5 hours of self-study apart from offline classes (morning/evening).
- Focus areas:
- Heavy focus on SQL for efficiency
- Consistent practice in Excel and Power BI via projects
- Pushing through difficulties in Python instead of giving up
She stresses that consistency matters more than long, irregular study sessions. Even when topics felt hard, she kept showing up and finishing project deadlines.
WsCube Tech Student Success Story: Placed at Stockverse (Full Interview Q & A)
Ayushi: Tell us about yourself and your background.
Nandini: I’m Nandini Athwani. I completed my Data Analytics course from WsCube Tech. I come from a science background (Biology), then switched to a Pharmacy background, which is totally medicinal. But I felt that only being a pharmacist is not enough in today’s AI-driven environment. After a lot of research online about what’s best for me to get higher-paying jobs, I came across Data Analytics courses. Someone suggested WsCube Tech, and I realized it’s very important to do something beyond just academic degrees. In today’s world, only degrees are not enough.
Ayushi: Why did you choose Data Analytics over other fields like web development, digital marketing, etc.?
Nandini: When I searched, I felt a Data Analytics course could connect with my Pharmacy background. In clinical research, data analysis is already a big part, and hospitals handle a lot of data. So I thought this is something correlated with my degree plus AI. I don’t have interest in digital marketing or web development. I love to visualize data, so I chose Data Analytics.
Ayushi: When you were learning Data Analytics, which skill felt the most difficult?
Nandini: Python, of course. That was the most difficult for me.
Ayushi: Which skill did you focus on the most during your learning?
Nandini: I focused the most on SQL. SQL is very fast and efficient, so I put a lot of focus there. I did work a lot in Python too, but it felt very high-level for me.
Ayushi: What tools and topics were covered in your course?
Nandini: It was a total five-month course, starting from basic to advanced: Advanced Excel, then SQL, Power BI, and of course Python and AI, all from very basic to advanced.
Ayushi: Coming from a non-technical background, what helped you the most during the course, lectures or projects?
Nandini: Lectures were of course very important. I used to watch offline classes and then rewatch online if I had doubts. But specially, the projects were very helpful. Projects give you real-world experience. Because of projects, I understood what actually happens in real companies. Shifting from a medical/biology background to an IT environment was very difficult initially, but since WsCube Tech taught from basics, I felt relaxed that I was understanding something. Staying consistent and working on projects was a must.
Ayushi: How many projects did you complete during the course?
Nandini: I did all the WsCube Tech projects. As far as I remember, around 6 to 8 projects, and I submitted all of them on time. After that, when we shifted more to AI, projects became fewer because the Python/AI part was more difficult for me. But I definitely completed 6 to 8 projects on time.
Ayushi: How many hours did you study daily apart from offline classes?
Nandini: Honestly, about 1 to 1.5 hours. Since my classes were during the day and my home was a bit far, I’d go half an hour early, then attend 1 to 1.5 hours of class, come back, rest a bit, and then study another 1 to 1.5 hours in the evening. That was enough for me because my mind was clear.
Ayushi: Can you explain your role, Operations Analyst at Stockverse, in simple words?
Nandini: I work at a trading company where we have a 20-person sales team. We basically have enormous data of these salespeople, and we have to organize it. First, we clean the data and organize it. Then we move to Power BI: we create dashboards and visualize the data. The second part is conversion tracking, how much conversion each salesperson has done, who is in the top five, etc. We do all these things in Excel and Power BI. So basically, it’s a mixture of Advanced Excel and Power BI.
Ayushi: In your current role, which tools do you use the most?
Nandini: Almost all the time, I use Excel and Power BI. Not really SQL or Python right now, because currently we are only on Power BI and Advanced Excel. We do use Excel with some automation to make things easier.
Ayushi: In your day-to-day work, where do you spend most of your time, data cleaning, dashboarding, or meetings?
Nandini: Most time goes into segregating and organizing the data because it’s very messed up and unorganized. That takes time. Meetings and Power BI dashboards happen once a week or once a month, where we collect all data, bring it to the dashboard, and tell the team: “This was our sales; this is where we stand right now.” So yes, cleaning takes more time. If your formulas are strong, it becomes easier.
Ayushi: Tell us about your interview experience. How did you apply, and how did you secure this role?
Nandini: When we talk about interviews, this was my first interview ever, so there was nervousness. But I had gained enough confidence that even if I didn’t know something, I could answer confidently. At WsCube Tech, they teach you to be very confident. In my first interview, they asked me many formulas, copy-paste formulas, advanced IFs, and so on. They also asked how I create a dashboard, how I visualize things, and “what if we are stuck in the current situation?”
For applying, I applied at many places. I created a proper LinkedIn profile, made profiles on Indeed, and kept applying regularly. Then I came across this company, applied, and got an interview call. The first time I got such a call, I thought, “Is this fake or real?” After gathering information, I realized it’s real. I was nervous, so I instantly contacted my mentors and asked them to brief me. They helped me a lot and told me to prepare certain formulas.
Ayushi: How helpful were your course projects in the interview?
Nandini: Projects were very helpful. I explained two to three projects that we did during the course, mostly Excel-based. That was really impressive for them, that I had done so many course projects.
Ayushi: Was it a walk-in interview? How was that experience?
Nandini: Yes, it was a walk-in interview. I was very nervous, shivering, thinking, “Will I get selected or not?” But when they started communicating, they made me relax. They said, “Just relax, there’s no issue if you’re nervous. Answer calmly; there’s no problem.” Their support was very good; they made me comfortable.
Ayushi: What kind of technical questions did you face in Excel?
Nandini: In Excel, they gave me a dataset of salespeople with their enrollments and payments. They asked me to separate them and extract specific information. I showed them some formulas, copy-paste techniques, conditional formatting, and charts. They also asked: “If our sales continue at this speed, what will happen in the next one year?” They also asked two to three case-study type questions: “If we have this situation, what would you do?” That’s where data visualization really helps.
Ayushi: What Power BI questions were asked?
Nandini: For Power BI, they mainly asked: “How do you create a dashboard?” Since it was my first interview and I was nervous, they kept it basic. They asked me to explain which charts I would use, how I would gather everything, and how I would add dropdowns/filters to show the full dashboard. So they asked only the basics.
Ayushi: Had you given any other interviews before this?
Nandini: No, this was my first-ever interview.
Ayushi: How important is communication in interviews, in your opinion?
Nandini: I think more than 50 to 55%. Communication is a major thing. Even if I didn’t know 2 to 3 questions, I confidently said, “Not today, I’m not prepared for this, but if I get experience, I will surely learn it.” So confidence matters a lot.
Ayushi: It’s been around 8 months since you started. What new things have you learned about the corporate world?
Nandini: Everything was new for me, Excel, how people talk, how meetings are conducted. Corporate life is completely different from real life. Every day I learn something new: how to work, in what manner to work, etc. I’ve learned many things after joining here.
Ayushi: For a fresher from a non-technical background, which skill do you think is most important for a Data Analyst?
Nandini: All skills are important, but it depends on your stage. If I’m a fresher, I feel Excel and Power BI are more important, including SQL, because SQL makes everything easy, cleaning, extraction, etc. As you move from fresher to advanced, Power BI and AI become more important, and you use more advanced tools. In our office, people with 2 to 3 years of experience use Power BI, Python, and SQL more deeply.
Ayushi: What advice would you give to freshers or career switchers based on your journey?
Nandini: My advice is: it doesn’t matter which background you come from. If you want to survive in today’s environment, AI and Data Analytics courses are very important. Second, consistency is very important. If it feels difficult, don’t quit; difficulty means you’re learning. Third, projects are the main thing. The better you do your projects and focus on them, the better your interviews will be. Ask as many doubts as possible, stay active, and be consistent.
Ayushi: In your current role, how much do you use AI?
Nandini: As a fresher, I’m still learning from more experienced people in my job. I’m observing how they use AI. I’ve learned quite a bit about running APIs, etc. If you need to create dashboards, you can drop a prompt to AI and it generates the query/logic. So I’m still in progress with AI, but I’ve learned a lot.
Ayushi: What are your next career steps? Do you plan to move into Data Science/Engineering or stay in Analytics?
Nandini: My path is fixed: I will go deeper into Data Analytics. I want to become much better in SQL, perfect my Python, and go deeper in analytics. In Pharmacy too, clinical research has a major role for data analysis. If you go deep in one field, I feel you can expect higher salary packages. So I will continue in Data Analytics.
Ayushi: Any feedback for our team to improve the experience for students like you?
Nandini: I already said this was my correct decision. At the start, I only wanted a degree, but coming to WsCube Tech, I realized you can do more beyond that. It doesn’t matter which field you’re from; here you’re taught from the very basics, and you get to work on very good projects. So it doesn’t matter what your background is, this was a very correct decision for me. I will definitely apply to bigger companies now. My mentors and the whole WsCube Tech team were very supportive.
Ayushi: Anything else you’d like to add for aspiring learners?
Nandini: Just stay focused and consistent. Wherever you have to learn, WsCube Tech is an excellent foundation. For me, it felt so good that I didn’t feel like, “I’ve never done this before.” Here, everything becomes easy.
Explore Our Data Related Courses
| Data Analytics Course | Live Internship + 100% Job Support |
| Business Analytics Course | Live Internship + 100% Job Support |
| Data Science Course | Live Internship + 100% Job Support |
Nandini’s Advice for Freshers and Career Switchers
Nandini’s key messages for anyone starting out, especially from non-tech backgrounds:
- Data analytics + AI skills are essential in today’s market, regardless of your degree.
- Be consistent: Difficulty means you’re learning; don’t quit when it gets tough.
- Focus heavily on projects: The better your projects, the stronger your interviews.
- Ask doubts actively and stay engaged in class and practice.
- It’s okay to start from zero; a good foundation (basic-to-advanced path) makes the shift possible.
For pharma/biology students specifically, she highlights that their domain knowledge can become a unique advantage in areas like clinical research analytics and healthcare data roles.
Become a Data Analyst with WsCube Tech's 100% Placement Support
Nandini cleared her first interview ever. Her course projects were what convinced the interviewers.
The Data Analytics Course at WsCube Tech is built to get you to the same place.
- Learn every tool you need: Advanced Excel, SQL, Power BI, Python and AI tools
- Live classes taught by mentors from Microsoft, Amazon and KPMG
- 10 real projects plus a 4 week internship to build your portfolio
- 1:1 mock interviews and interview prep, so you walk in confident like Nandini did
- 100% placement support: resume building and referrals to 350+ companies
280+ students placed. 90% median hike. Rated 4.9 by 1,032 learners.
Enroll in the Data Analytics Course Today!
Join Our On-Campus Data Analytics Course





Leave a comment
Your email address will not be published. Required fields are marked *Comments (0)
No comments yet.