
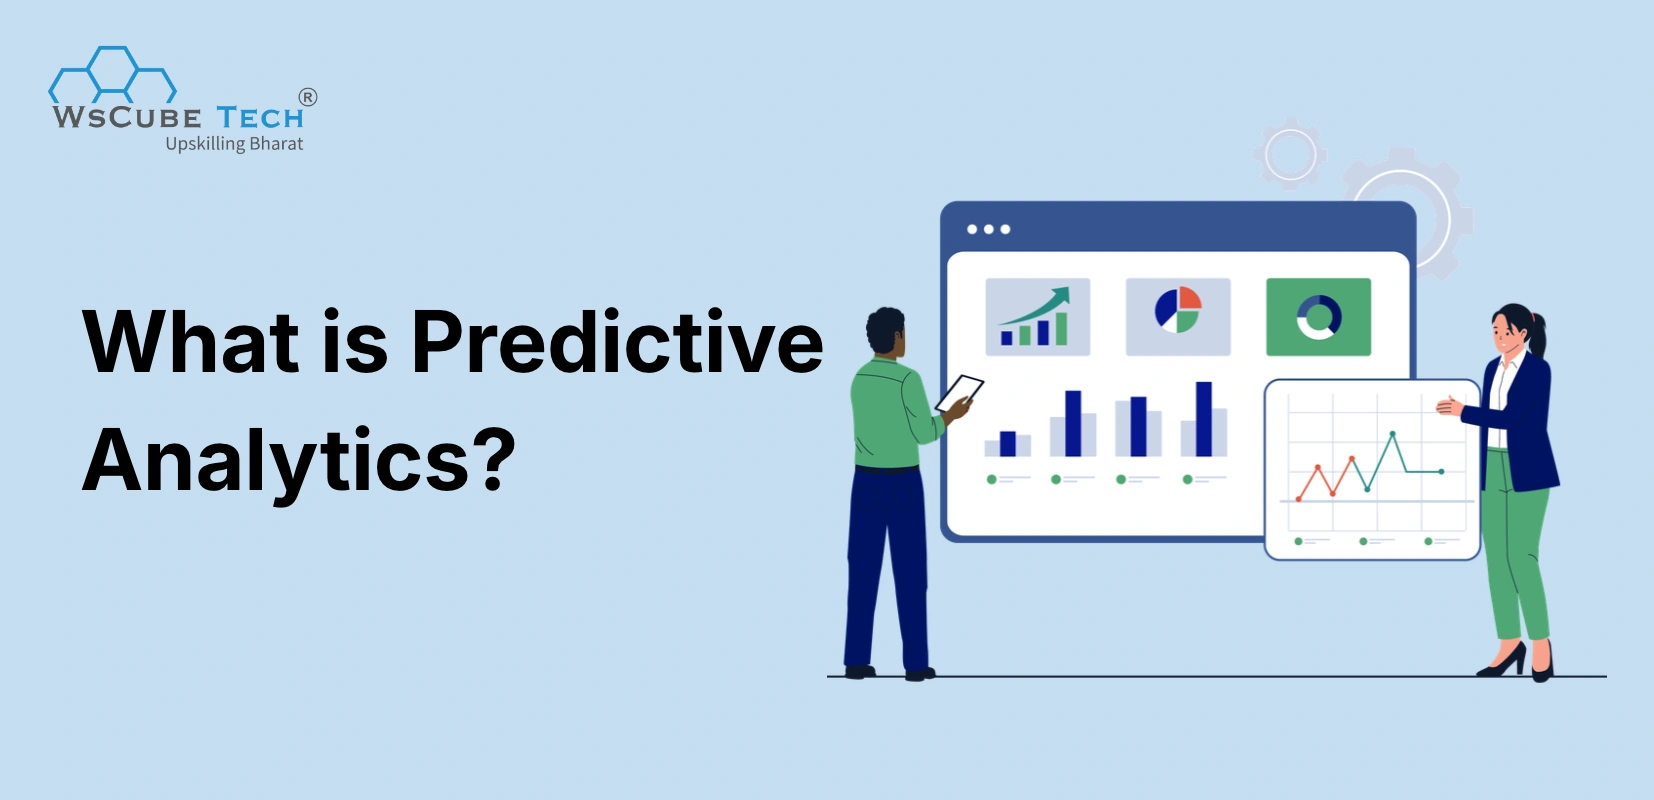
Every business wants to make better decisions about the future. Predictive analytics helps organizations estimate what might happen next by analyzing historical data, identifying patterns, and applying statistical methods or machine learning. From forecasting sales to identifying customer churn, it supports smarter planning. This guide covers what predictive analytics is, how it works, its common techniques, real-world examples, benefits, limitations, and tools.
Key Takeaways:
- Predictive analytics uses historical data to forecast future outcomes and trends.
- It sits between "what happened" and "what should we do" in the analytics lifecycle.
- Common techniques include regression, classification, clustering, and time series forecasting.
- It is used in retail, healthcare, banking, manufacturing, marketing, and logistics.
- Good data quality matters more than a fancy model.
- Students can start learning it with Excel, SQL, and Python.
Predictive Analytics Meaning & Definition
Predictive analytics is the practice of studying past and present data to estimate what is likely to happen in the future. It does not give a promise. It gives a well-supported guess, with a level of confidence attached.
So, what is predictive analytics in precise words? It is a data-driven way of turning old records into useful forecasts. Think of a weather report. Meteorologists study past weather patterns and current conditions to say there is a 70 percent chance of rain. Predictive analytics works the same way for business questions.
Here is how it is built and what it includes:
- Data: It starts with historical data such as sales records, customer clicks, patient reports, or sensor readings.
- Methods: Analysts apply statistics, data mining, and machine learning to find patterns in that data.
- Models: These patterns are turned into a model, which is a set of rules or equations that can score new data.
- Output: The model gives a prediction, such as a probability, a score, or a forecast number.
- Action: Teams use the result to make smarter decisions, such as who to call first or what stock to order.
The key idea is simple. If something happened in a certain way many times before, there is a good chance it will happen again under similar conditions. The model learns that pattern and applies it to new situations.
Where Predictive Analytics Fits Among the Four Types
Where Predictive Analytics Fits Among the Four Types
Predictive analytics is the third of the four types of business analytics. Each type serves a different purpose, helping businesses move from understanding past performance to making informed decisions about the future.
- Descriptive Analytics: What Happened? Summarizes historical data to understand past performance and identify trends.
- Diagnostic Analytics: Why Did It Happen? Examines historical data to identify the reasons behind specific outcomes.
- Predictive Analytics: What Might Happen? Uses historical data, statistical techniques, and machine learning to forecast potential future outcomes.
- Prescriptive Analytics: What Should We Do? Recommends actions based on predicted outcomes, business goals, and available resources.
For example, a telecom company can use predictive analytics to identify customers who are likely to cancel their subscriptions. It can then use prescriptive analytics to recommend targeted retention offers, such as discounts or upgraded plans, to reduce customer churn.
Upcoming Masterclass
Attend our live classes led by experienced and desiccated instructors of Wscube Tech.

How Does Predictive Analytics Work?
Predictive analytics follows a clear workflow, from a business question to a working model. Each step builds on the one before it, and skipping one usually leads to weak results. Here is the process in seven steps.
Step 1: Define the Goal
- Business question: Decide exactly what you want to predict, such as customer churn, loan default, or next month's demand. A vague goal leads to a vague model.
- Success measure: Choose how you will judge the result, for example accuracy, cost saved, or revenue gained, before you build anything.
Step 2: Collect the Data
- Data sources: Gather relevant records from databases, spreadsheets, apps, websites, sensors, and third-party sources. More relevant history usually helps the model learn better.
- Data volume: Check that you have enough examples of both outcomes. A model cannot learn to spot fraud if it has seen only a handful of fraud cases.
Step 3: Clean and Prepare the Data
- Cleaning: Fix missing values, remove duplicates, and correct errors. Messy data is the most common reason a model fails, so this step often takes the most time.
- Feature creation: Turn raw columns into useful inputs, such as "days since last purchase" or "average order value," so the model can find stronger signals.
Step 4: Choose and Build a Model
- Model selection: Pick a technique that matches your goal. Use regression for numbers, classification for yes or no answers, and time series for trends over time.
- Model building: Feed the prepared data into the algorithm so it can learn patterns. Start with a simple model first, then try more complex ones if needed.
Step 5: Train, Test, and Validate
- Data split: Divide your data into a training set and a test set. The model learns from the first and is judged on the second, which it has never seen.
- Performance check: Measure accuracy, precision, recall, or error rate. If results are weak, adjust the features or try another algorithm.
Step 6: Deploy the Model
- Integration: Connect the model to real systems, such as a CRM, a website, or a dashboard, so that predictions reach people when they need them.
- Action plan: Decide who will act on the predictions and how. A forecast that no one uses has no business value.
Step 7: Monitor and Improve
- Tracking: Watch the model over time. Customer habits and markets change, so a model that worked last year may slowly lose accuracy.
- Retraining: Update the model with fresh data on a regular schedule, and keep notes on what changed so results stay reliable.
Common Predictive Analytics Techniques
There is no single method that fits every problem. Analysts choose from a toolbox, depending on the data and the question. Learning the main predictive analytics techniques gives you a strong foundation, and most of them fall into the groups below.
1. Regression Analysis
Regression predicts a number by studying how variables relate to each other. Linear regression, for example, can estimate house prices using size, location, and age. It is simple, fast, and easy to explain, which makes it a favorite starting point for beginners and a trusted tool in finance and economics.
2. Classification Models
Classification sorts items into categories. It answers questions such as "Will this customer buy or not?" or "Is this email spam?" Popular methods include logistic regression, naive Bayes, and support vector machines. Banks often use classification to decide whether a loan applicant is likely to repay.
3. Decision Trees
A decision tree splits data into branches using simple yes or no questions, much like a flowchart. It is easy to read, even for non-technical teams. A tree might ask whether a customer is over 30, then whether they bought in the last 60 days, and finally predict whether they will return.
4. Random Forests and Gradient Boosting
These are "ensemble" methods that combine many small models to make one stronger prediction. A random forest builds many decision trees and averages their votes. Gradient boosting builds trees one after another, with each fixing the mistakes of the last. Both are widely used because they are accurate on real-world data.
5. Time Series Forecasting
Time series models study data collected over time to predict future values. They look for trends, seasonal patterns, and cycles. Retailers use them to forecast festival demand, and energy companies use them to estimate electricity use. Common methods include moving averages, ARIMA, and exponential smoothing.
6. Clustering
Clustering is an unsupervised learning technique that groups similar data points based on shared characteristics. For example, businesses can use it to group customers according to their purchasing habits. Although clustering does not directly predict future outcomes, it can support predictive analytics by revealing patterns that help businesses understand customer behavior and improve forecasting.
7. Neural Networks and Deep Learning
Neural networks can identify complex patterns in large datasets and are used in applications such as image recognition, speech processing, and advanced forecasting. However, they may require substantial data and computing resources and can be harder to interpret than simpler models. Their suitability depends on the problem, data availability, performance requirements, and need for explainability.
8. Text and Sentiment Analysis
Natural language processing lets models read text such as reviews, emails, and social posts. Sentiment analysis predicts whether a customer feels happy or upset. Companies use these signals to predict churn, spot product issues early, and improve their customer support.
Descriptive vs Diagnostic vs Predictive vs Prescriptive Analytics
The four types of analytics work together, and each one answers a different question. The table below makes the differences easy to compare. If you want a deeper look at each stage, our guide on business analytics types covers them in detail.
| Feature | Descriptive Analytics | Diagnostic Analytics | Predictive Analytics | Prescriptive Analytics |
| Key question | What happened? | Why did it happen? | What might happen? | What should we do? |
| Time focus | Past | Past | Future | Future |
| Main methods | Reports, dashboards, summaries | Drill-down analysis, correlation, root-cause analysis | Regression, classification, forecasting | Optimization, simulation, recommendation |
| Typical output | Charts and summaries | Possible reasons and contributing factors | Predictions and forecasts | Recommended actions |
| Example | Monthly sales report | Investigating a sales decline | Forecasting next quarter's sales | Recommending stock levels and prices |
Most organizations begin with descriptive reports and move upward as their data skills grow. You do not need to master every type at once. However, each stage depends on the one before it, so a weak base in reporting and diagnosis will limit the quality of your predictions.
Predictive Analytics Examples and Applications
Prediction is no longer limited to big technology firms. It now appears in almost every industry. These predictive analytics examples show how organizations use forecasts to save money, reduce risk, and serve people better.
1. Retail and E-commerce
Retailers predict which products will sell, and when. They use past sales, seasons, weather, and promotions to plan stock. Online stores also predict what a shopper may want next and show those items first. This reduces unsold goods and improves the customer experience.
2. Healthcare
Hospitals use models to predict which patients face a higher risk of readmission or complications. Doctors can then provide earlier follow-up care. Predictive tools also help forecast patient numbers so hospitals can plan staff and beds, and they support early detection of conditions from scans and test data.
3. Banking and Finance
Banks predict credit risk to decide who qualifies for a loan and at what rate. They also use real-time models to flag unusual card activity that may signal fraud. Insurance companies predict claim likelihood to set fair premiums and spot suspicious claims.
4. Manufacturing
Factories use sensor data and predictive models to estimate when equipment may fail. This approach, known as predictive maintenance, helps maintenance teams identify potential problems before a breakdown occurs. By scheduling inspections and repairs proactively, manufacturers can reduce unexpected downtime, control maintenance costs, and improve operational efficiency.
5. Marketing and Sales
Marketers score leads to find which ones are most likely to buy. They predict customer lifetime value, choose the best time to send an email, and estimate campaign results before spending the budget. This is one of the most visible uses of predictive analytics in business, because the results connect directly to revenue.
6. Telecom and Subscription Services
Telecom and streaming companies predict churn, which means customers who may cancel. Once a model flags a risky customer, the team can offer a better plan or a discount. Retaining an existing customer is usually cheaper than finding a new one.
7. Logistics and Supply Chain
Delivery companies predict traffic, weather delays, and demand peaks. They use this to plan routes, set delivery times, and place warehouses closer to expected demand. Better forecasts mean fewer late deliveries and lower fuel costs.
8. Human Resources
HR teams predict which employees may leave and which candidates are likely to succeed in a role. This helps them improve hiring, plan training, and fix workplace problems early. These models need careful handling, because people's careers are affected by the results.
9. Education
Colleges predict which students may struggle or drop out by studying attendance, grades, and activity on learning platforms. Advisors can then offer extra support in time. Some universities also forecast admissions numbers to plan classrooms and teachers.
Keep Reading: Guides That Answer Your Next Question
Benefits of Predictive Analytics
Predictive analytics helps organizations make informed decisions by estimating future outcomes from historical data. When implemented effectively, it can improve planning, reduce unnecessary costs, identify potential risks, and help businesses respond to customer needs. Here are the main benefits.
1. Better and Faster Decisions
Predictions replace guesswork with evidence. Managers can compare likely outcomes before they commit money or time. Instead of arguing based on opinion, teams can look at what the data suggests will happen.
2. Lower Costs and Less Waste
Accurate demand forecasts reduce overstocking and shortages. Predictive maintenance reduces emergency repairs. Fraud models stop losses before they grow. Each of these cuts costs in a clear, measurable way.
3. Higher Revenue and Sales
When teams know which customers are likely to buy, they can focus effort where it counts. Personalized offers and well-timed messages lead to better conversion rates. Companies can also find new opportunities by spotting rising trends early.
4. Stronger Customer Experience
Prediction helps businesses understand what people want before they ask. Customers receive more relevant suggestions, faster service, and fewer problems. Over time, this builds trust and loyalty.
5. Reduced Risk
Banks, insurers, and healthcare providers use forecasts to see danger early. A model can warn about credit defaults, safety issues, or supply problems while there is still time to respond. This protects both money and reputation.
6. Competitive Advantage
Organizations that forecast well can move first. They adjust prices, stock, and campaigns while slower competitors are still reading last month's report. This speed becomes more valuable as markets change faster.
7. Better Use of Time and Staff
Automated scoring and forecasting free analysts from repetitive work. Teams can spend more time on strategy and on explaining results. Sales staff can call the best leads first instead of working through a long list.
Challenges & Limitations of Predictive Analytics
Prediction is powerful, but it is not magic. Beginners should understand its limits so they can use it responsibly and set realistic expectations.
1. Poor Data Quality
A predictive analytics model is only as reliable as the data it uses. Missing, outdated, inconsistent, or biased data can lead to inaccurate forecasts and misleading insights. These issues can affect decision-making, reduce model performance, and cause businesses to make costly mistakes. Therefore, organizations must ensure their data is accurate, complete, relevant, and regularly updated.
2. Data Privacy and Ethics
Predictions often use personal information, such as purchases, health records, or location. Organizations must follow privacy laws and collect only what they need. Customers should know how their data is used, and companies should protect it with strong security.
3. Bias in Models
If past data contains unfair patterns, the model can learn and repeat them. For example, a hiring model trained on biased history may favor certain groups. Teams need to test for fairness and review results with care.
4. Overfitting and Underfitting
Overfitting happens when a model memorizes old data so closely that it fails on new data. Underfitting happens when a model is too simple to learn the pattern. Testing on unseen data and keeping models reasonably simple helps avoid both problems.
5. Lack of Skills and Resources
Building and maintaining models needs people who understand statistics, coding, and the business. Many small companies lack this talent or the budget for tools. This is one reason learning these skills, through a structured business analytics course, can open good career doors.
6. Changing Conditions
The past is not always a perfect guide. Sudden events, such as a pandemic, a new competitor, or a policy change, can break old patterns. Models need regular monitoring and retraining so they do not drift away from reality.
7. Hard to Explain
Complex models, especially deep neural networks, can act like a "black box." People may not understand why a certain prediction was made. This is a problem in areas like lending and healthcare, where decisions must be explained clearly.
Best Predictive Analytics Tools and Software
You do not need expensive software to begin. The right tool depends on your budget, your skills, and the size of your data. Here is a practical overview.
1. Microsoft Excel
Excel is the easiest place to start. It offers trend lines, forecasting sheets, and basic regression. It cannot handle very large data, but it is perfect for learning the core ideas and for quick small forecasts.
2. Python
Python is the most popular language for predictive work. Libraries such as pandas, scikit-learn, statsmodels, and TensorFlow cover data cleaning, modeling, and deep learning. It is free, widely supported, and has a large community of learners.
3. R
R is built for statistics and is strong in research and academic work. Packages such as caret and forecast make modeling and time series work simpler. Many analysts use it for detailed statistical testing and clear charts.
4. SQL
SQL is not a modeling tool, but it is essential. Most business data sits in databases, and SQL is how you pull, filter, and join it. Strong SQL skills make every later step faster and cleaner.
5. SAS and IBM SPSS
These are long-established enterprise tools. They are common in banking, insurance, and healthcare, where reliability and support matter. They offer menu-driven interfaces, which helps people who prefer not to write much code.
6. RapidMiner and Alteryx
These platforms use drag-and-drop workflows, so users can build models without heavy coding. They are useful for teams that want quick results and clear, visual steps from raw data to prediction.
7. Power BI and Tableau
These tools are mainly for dashboards and visuals, yet both include forecasting features and connect to machine learning models. They help present predictions in a form that managers can read and act on quickly.
8. Cloud Platforms
Google Vertex AI, Microsoft Azure Machine Learning, and Amazon SageMaker let teams build, deploy, and scale models in the cloud. They suit larger projects and offer ready-made services for tasks like forecasting and anomaly detection.
Recommended Professional Certificates
Data Analytics Course with Gen AI
Data Science Course with Internship & Placement Support
How to Get Started with Predictive Analytics
Whether you are a student or a business owner, you can begin step by step. You do not need to learn everything first. Here is a simple path.
1. Learn the Basics of Statistics
Understand averages, probability, distributions, correlation, and hypothesis testing. These ideas are the language of prediction. Free videos and beginner textbooks are enough to build a solid base.
2. Get Comfortable with Excel and SQL
Practice cleaning data, building pivot tables, and writing simple queries. These two skills appear in almost every analytics job, and they teach you how data is organized.
3. Pick Up Python or R
Choose one language and stay with it long enough to become comfortable. Learn to load data, clean it, draw charts, and build a basic regression or classification model.
4. Practice on Real Datasets
Use free datasets from sites like Kaggle or government portals. Try small projects, such as predicting house prices, student grades, or customer churn. Real practice teaches more than theory alone.
5. Build a Small Portfolio
Save your projects on GitHub or a personal page. Explain the problem, the data, the method, and the result in simple words. Employers like to see clear thinking, not just code.
6. Start Small in a Business
If you run or work in a business, pick one clear question, such as predicting next month's sales. Use the data you already have, test a simple model, and measure the result. Grow from there once you see value.
7. Keep Learning
Tools and methods change quickly. Follow industry blogs, join communities, and take structured courses when you need guidance. Steady practice matters more than speed.
The Future of Predictive Analytics
The field is changing fast, and the next few years will bring new possibilities. Here are the main trends to watch.
1. AI and Automated Machine Learning
AutoML tools can now choose models, tune settings, and test results with little manual effort. Generative AI is also helping analysts write queries, explain results, and draft reports faster.
2. Real-Time Predictions and Edge Analytics
More systems now predict as events happen, not after the fact. Payment checks, delivery tracking, and personalized offers all use live data. Sensors in machines, vehicles, and wearables generate huge streams of data. Running models close to where data is created, called edge computing, reduces delay.
3. Explainable AI and Responsible Use
Explainable AI helps people understand why a model made a choice. Tools that show which factors drove a prediction will help build trust, especially in finance and healthcare. Future teams will also need to prove that their models are fair, secure, and well documented.
4. Growing Career Demand
As more firms adopt forecasting, the need for skilled people keeps rising. Roles such as data analyst, data scientist, and machine learning engineer are expected to stay in demand, so learning these skills now is a practical choice.
These developments are also shaping the broader future of business analytics, where AI, predictive modeling, and real-time data are changing how businesses make decisions.

FAQ's About Predictive Analytics
It is used to forecast future outcomes using past data. Common uses include predicting sales, customer churn, credit risk, equipment failure, fraud, and patient risk, so organizations can plan and act earlier.
Predictive analytics tells you what is likely to happen. Prescriptive analytics goes further and recommends what action to take. In short, predictive forecasts the future, while prescriptive suggests the best response to it.
The most common predictive analytics techniques are regression, classification, decision trees, random forests, gradient boosting, time series forecasting, clustering, and neural networks. The right choice depends on your data and your goal.
Examples include retailers forecasting demand, banks scoring loan risk, hospitals predicting readmissions, factories predicting machine failure, and streaming apps recommending shows. Telecom firms also predict which customers may cancel.
Hospitals predict patient risk, readmissions, and disease progression. They also forecast admissions to plan staff and beds. These predictions help doctors give earlier care and use resources more wisely.
They overlap closely. Predictive analytics is a goal, which is forecasting. Machine learning is a set of methods often used to reach it. Classic statistics can also do the job, so not every model needs AI.
Popular tools include Excel, SQL, Python, R, SAS, IBM SPSS, RapidMiner, Alteryx, Power BI, Tableau, and cloud platforms such as Azure Machine Learning and Amazon SageMaker. Python and SQL are the most common starting points.
The main benefits are better decisions, lower costs, higher revenue, reduced risk, improved customer experience, and a competitive edge. It also saves time by automating scoring and forecasting work.
Key challenges include poor data quality, privacy concerns, model bias, overfitting, skill gaps, and changing conditions. Models also need regular monitoring and retraining to stay accurate over time.
Start with one clear question, such as forecasting next month's sales. Gather clean data, test a simple model in Excel or Python, measure the result, and expand only after the first project proves its value.
Conclusion
Predictive analytics turns history into foresight. It helps organizations estimate demand, reduce risk, serve customers better, and spend money wisely. You have seen what it is, where it fits in the analytics lifecycle, how the process works, the main techniques, real examples, benefits, challenges, tools, and a clear way to begin.
The value of predictive analytics in business will keep growing as data becomes easier to collect and models become easier to build. For students, this is a strong skill to learn now. Start small, practice on real data, stay curious, and build your skills one project at a time.
Want to build a stronger foundation in data analysis and business decision-making? Explore the Business Analytics Course to learn essential analytical skills and practice working with data.
Build Job-Ready Skills with Our Online Courses
Join Our On-Campus Data-Related Programs
| Data Analytics Course in Jaipur | Data Analytics Course in Jodhpur |
| Data Science Course in Jaipur | Data Science Course in Jodhpur |
Explore Our Free Courses


Leave a comment
Your email address will not be published. Required fields are marked *Comments (0)
No comments yet.