Best Data Analytics Course in India
Kickstart your career with WsCube Tech's Online Data Analytics Course, designed to turn beginners into job-ready professionals. This industry-focused data analytics course helps you master essential tools, real-world projects, and practical skills that top companies demand.
With expert mentorship, hands-on training, and a structured learning path, you'll gain the confidence to analyze data, uncover insights, and make smarter business decisions.
Whether you are a student, working professional, or career switcher, our comprehensive data analysis course equips you with in-demand skills like Excel, SQL, Python, and data visualization. At WsCube Tech, we focus on practical learning, ensuring you build a strong portfolio and stay ahead in the competitive job market.
Why Choose WsCube Tech's Online Data Analytics Course?
Master in-demand skills with WsCube Tech's data analysis course online, designed to provide practical training, real-world projects, and industry-relevant expertise for career growth.
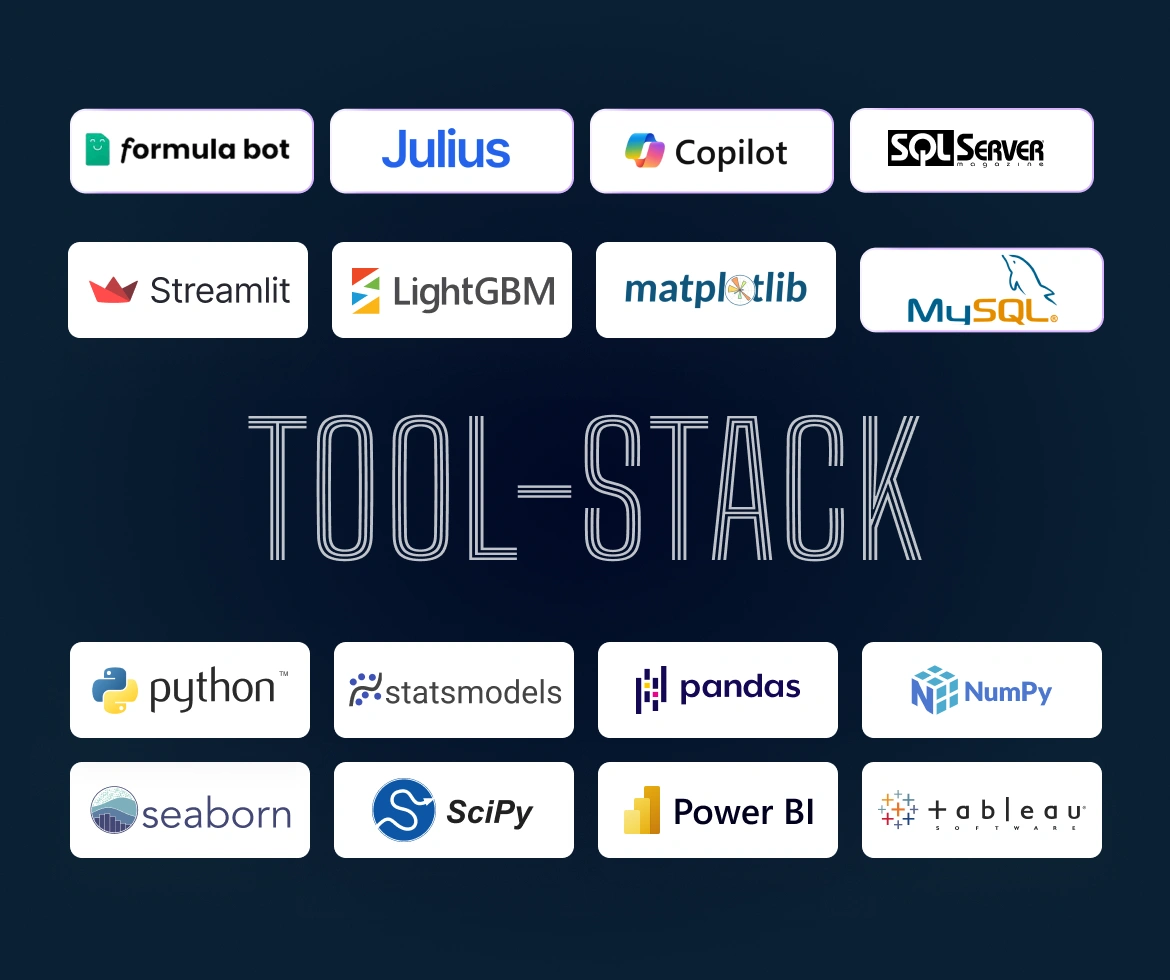
1. Industry-Relevant Curriculum: The course curriculum is designed as per current industry standards, covering tools like Excel, SQL, Python, Power BI, and Tableau to ensure learners gain practical and job-ready analytical skills.
2. Hands-On Practical Training: Students work on real-world datasets and live projects, helping them understand data analysis concepts deeply and build strong portfolios that attract recruiters and hiring managers effectively.
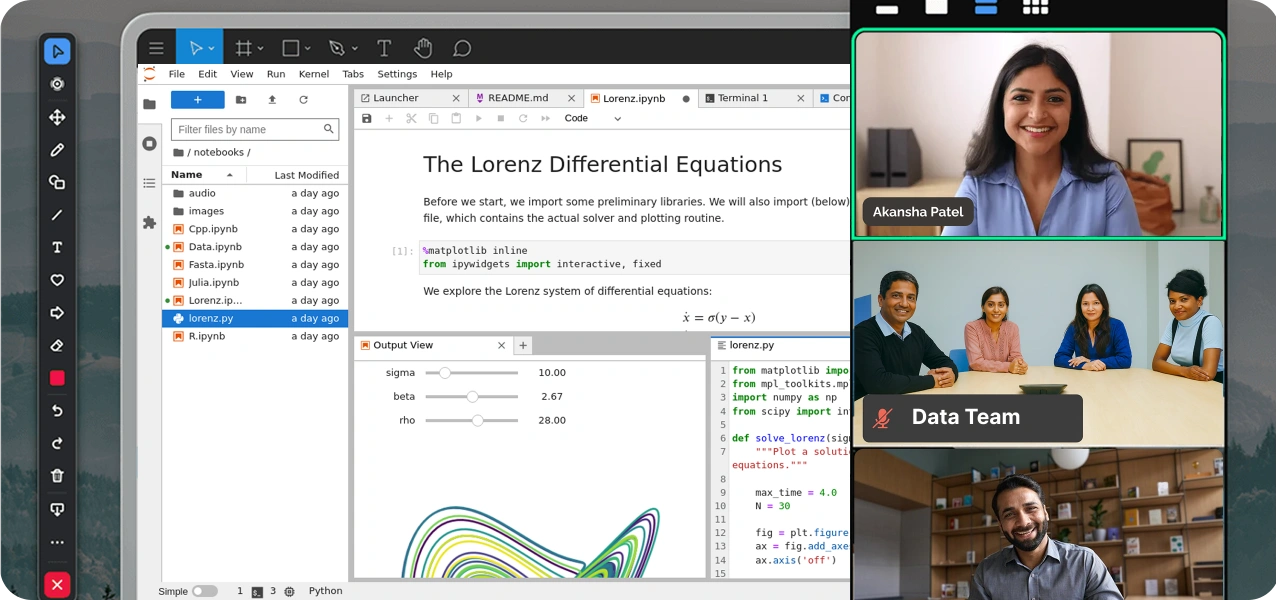
3. Expert Mentorship: Learn directly from experienced industry professionals who bring real insights, practical knowledge, and guidance, ensuring you understand how data analytics is applied in real business scenarios.
4. Real-World Projects: The course includes multiple capstone projects that simulate real business problems, allowing learners to practice data cleaning, visualization, and decision-making using actual industry-level data sets.
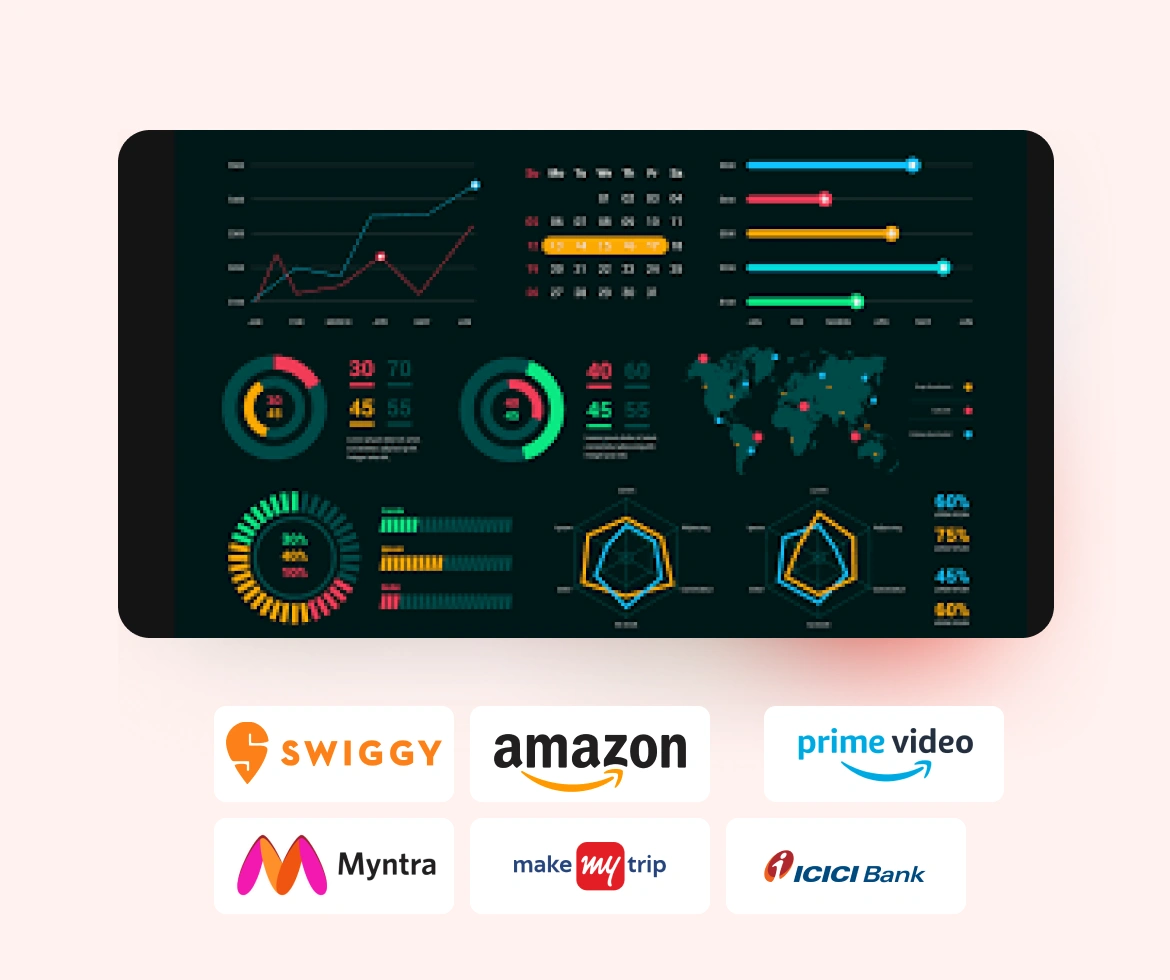
5. Placement Assistance: WsCube Tech provides dedicated career support, including resume building, interview preparation, and job referrals, helping learners confidently apply for roles in top companies across industries.
6. Beginner to Advanced Learning Path: Whether you are a beginner or looking to upgrade skills, the structured learning path ensures smooth progression from basics to advanced data analytics concepts without confusion.
7. Flexible Online Learning: The course offers flexible schedules, recorded sessions, and lifetime access to materials, allowing learners to study anytime, anywhere, without disturbing their personal or professional commitments.
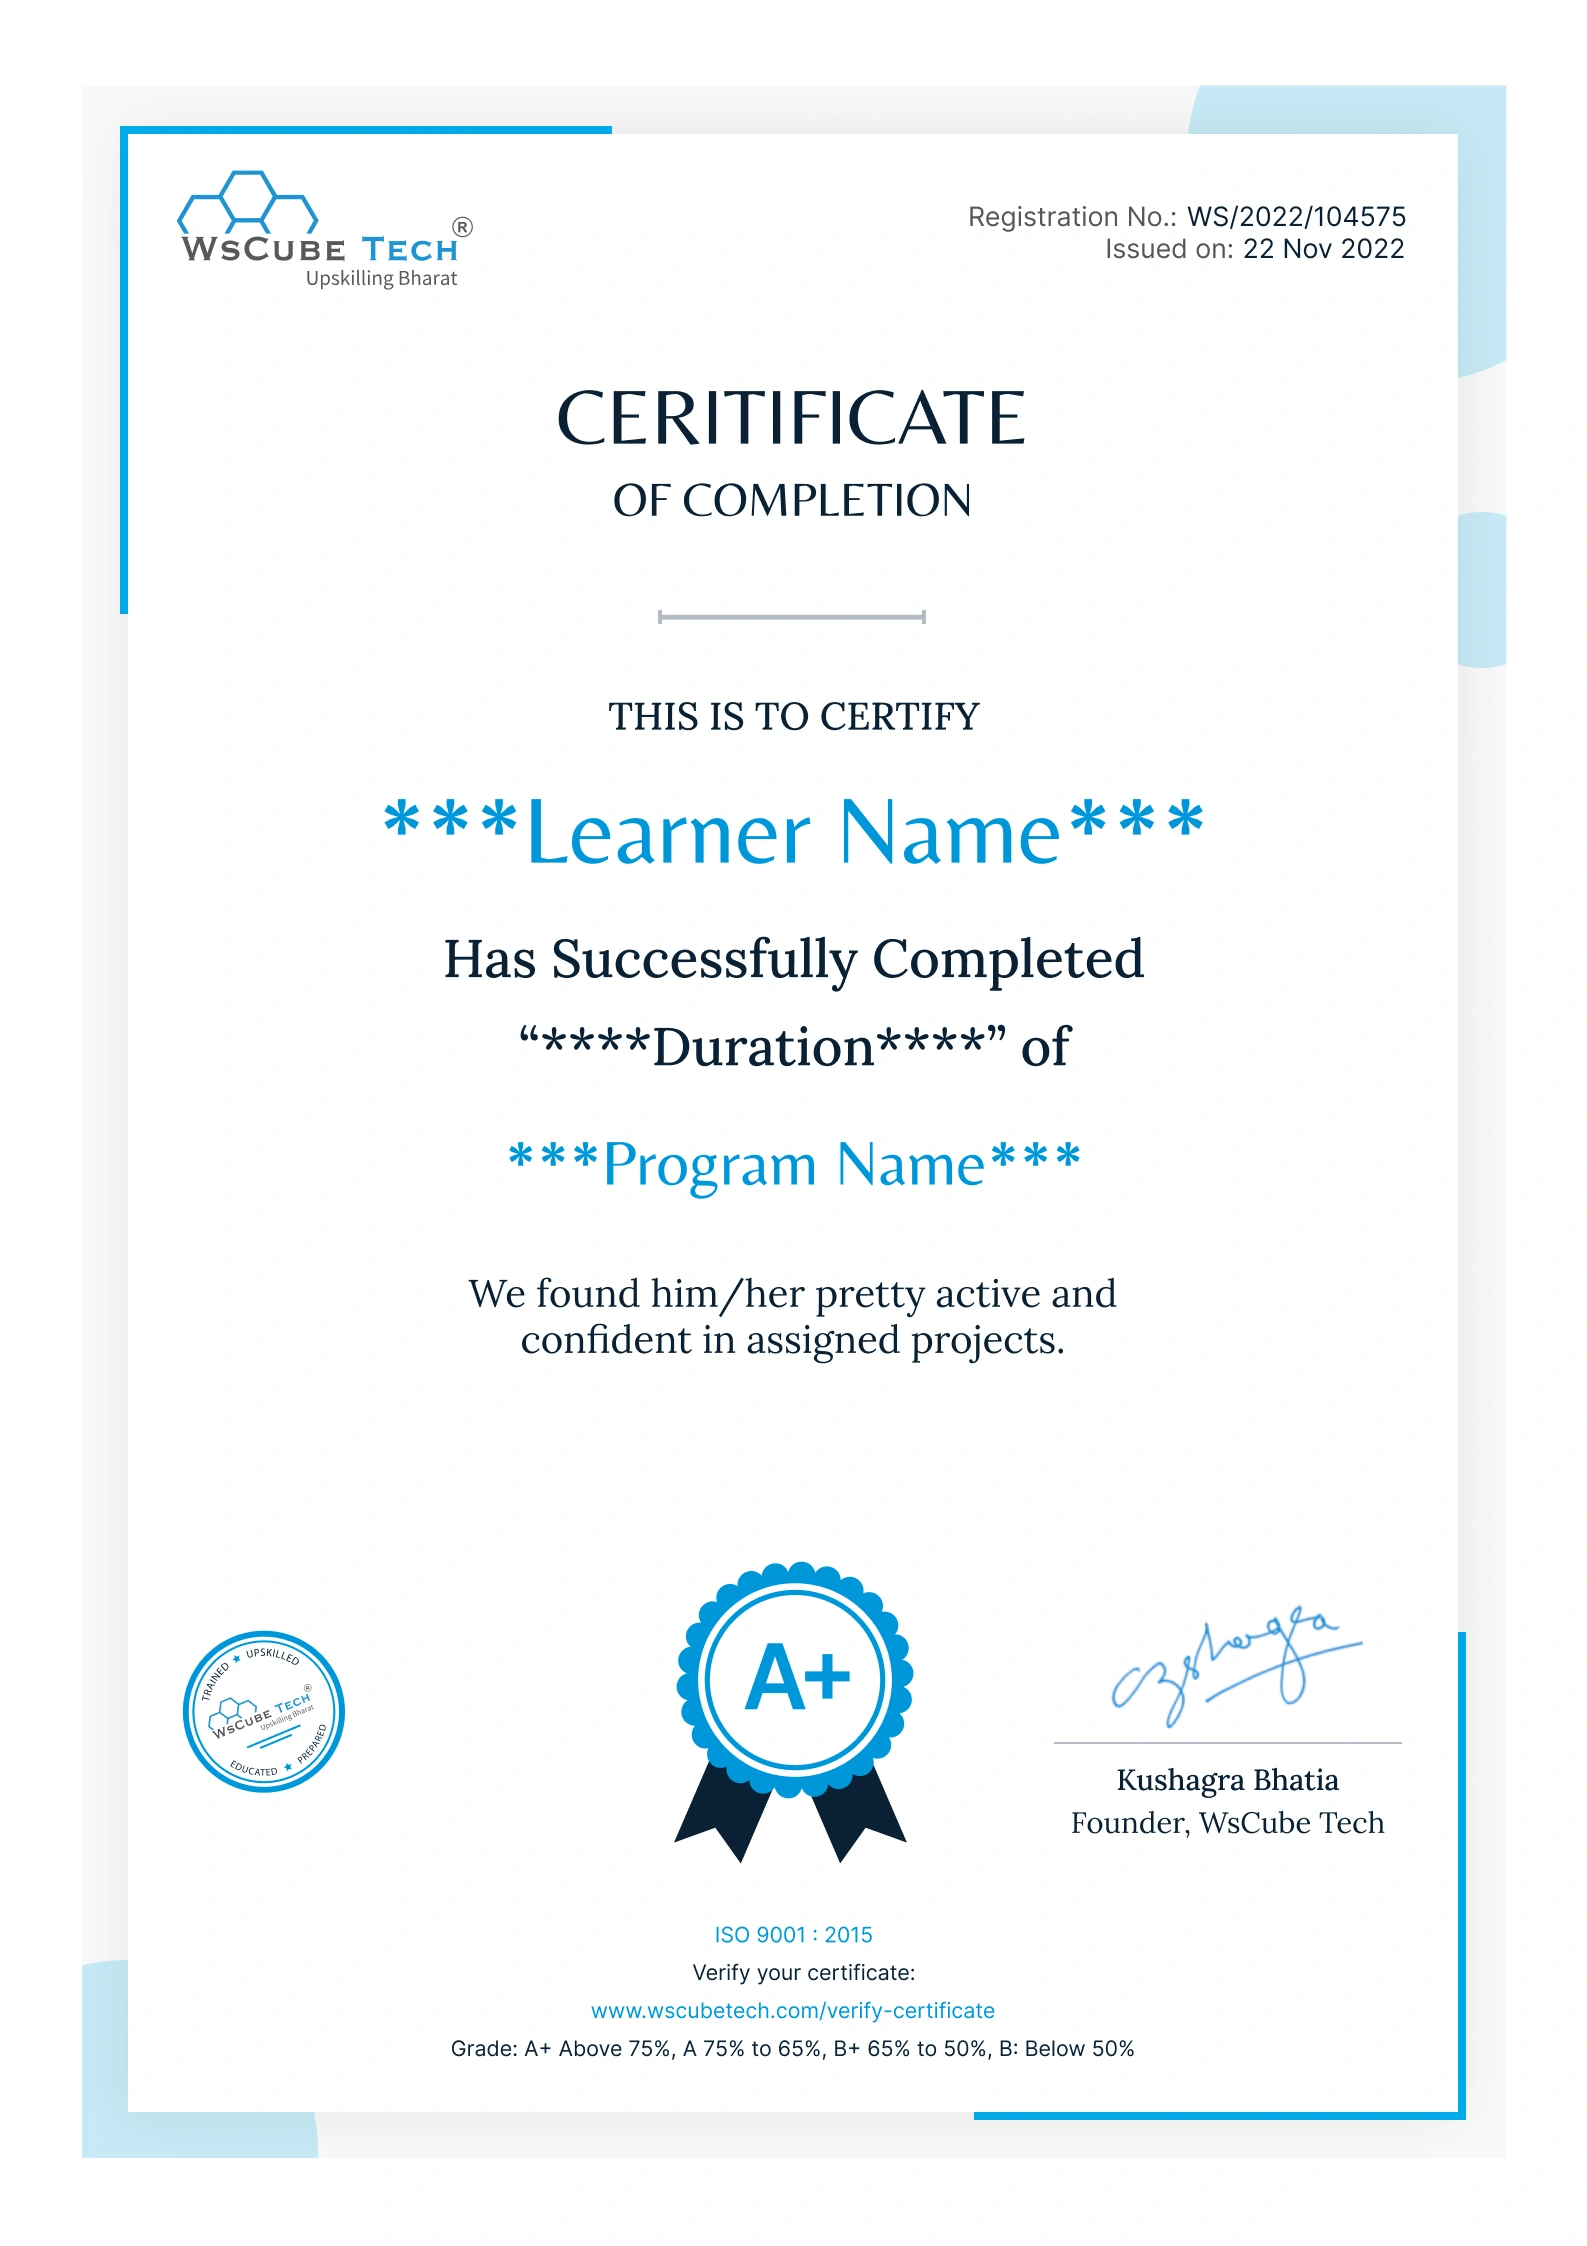
8. Certification and Career Growth: Upon completion, learners receive a recognized certification that validates their skills and boosts credibility, helping them secure better job opportunities and career advancement in data analytics.
Career Opportunities After an Online Data Analytics Course
Completing an online data analysis course opens diverse career paths in analytics, helping you secure high-demand roles across industries with strong growth potential.
1. Data Analyst: A data analyst collects, processes, and interprets data to help organizations make informed decisions using tools like Excel, SQL, and visualization platforms effectively.
2. Business Analyst: Business analysts bridge the gap between data insights and business strategies by analyzing trends, identifying opportunities, and recommending solutions to improve organizational performance and growth.
3. Data Scientist: Data scientists use advanced analytics, machine learning, and statistical techniques to extract meaningful insights from complex datasets, enabling predictive decision-making and innovation across industries globally.
4. Data Engineer: Data engineers design, build, and maintain data pipelines and architectures, ensuring smooth data flow and accessibility for analysts and scientists to perform efficient analysis tasks.
5. Financial Analyst: Financial analysts evaluate financial data, market trends, and investment opportunities to guide businesses and individuals in making strategic financial decisions and managing risks effectively.
6. Marketing Analyst: Marketing analysts analyze customer behavior, campaign performance, and market trends to optimize marketing strategies, improve ROI, and drive better engagement and conversions for businesses.
7. Operations Analyst: Operations analysts use data-driven insights to improve business processes, enhance efficiency, reduce costs, and streamline workflows across various departments within an organization.
8. Product Analyst: Product analysts study user behavior and product performance metrics to help companies enhance product features, improve user experience, and make data-backed product decisions.
9. Business Intelligence Analyst: BI analysts create dashboards and reports using tools like Power BI and Tableau, transforming raw data into actionable insights for strategic decision-making and business growth.
10. Data Consultant: Data consultants work with multiple clients to provide expert advice, analyze business data challenges, and implement data-driven solutions to improve overall performance and competitiveness.
Others vs WsCube Tech's Online Data Analytics Course
Choosing the right data analyst course matters for your career growth. Compare WsCube Tech with others to understand why it stands out in delivering practical, industry-focused data analytics training.
| Feature | Others | WsCube Tech |
|---|
| Course Approach | Mostly theoretical learning | Practical, project-based learning |
| Curriculum | Outdated or generic syllabus | Updated, industry-relevant curriculum |
| Trainers | Limited industry exposure | Expert mentors with real-world experience |
| Hands-on Projects | Few or no real-world projects | Multiple live projects and case studies |
| Tools Covered | Basic tools coverage | Excel, SQL, Python, Power BI, Tableau |
| Career Support | Minimal or no placement assistance | Resume building and interview preparation |
| Learning Flexibility | Fixed schedules | Flexible online learning with recordings |
| Certification Value | Basic completion certificate | Industry-recognized certification |
| Practical Exposure | Limited real-world application | Strong focus on real business scenarios |
| Job Readiness | Requires additional self-learning | Job-ready skills with portfolio development |
How to Enroll in Our Online Data Analytics Course?
Enroll in the online data analytics course and start your journey through a simple, guided registration process today.
1. Visit the Official Website: Go to the official WsCube Tech website and navigate to the data analytics course page to explore course details, curriculum, duration, fees, and learning outcomes clearly.
2. Fill Out the Inquiry Form: Click on enroll or apply now, then complete the registration form by entering your basic details like name, email, phone number, and preferred learning mode.
3. Connect with Course Counselor: After submitting the form, a course advisor will contact you to guide you about batches, schedule, payment options, and help you choose the best learning path.
4. Complete the Payment Process: Proceed with secure payment using available methods such as online transfer, UPI, or card payment to confirm your seat in the selected course batch.
5. Start Learning: Once enrolled, get access to course materials, live sessions, and recordings, allowing you to begin your learning journey and build strong data analytics skills confidently.