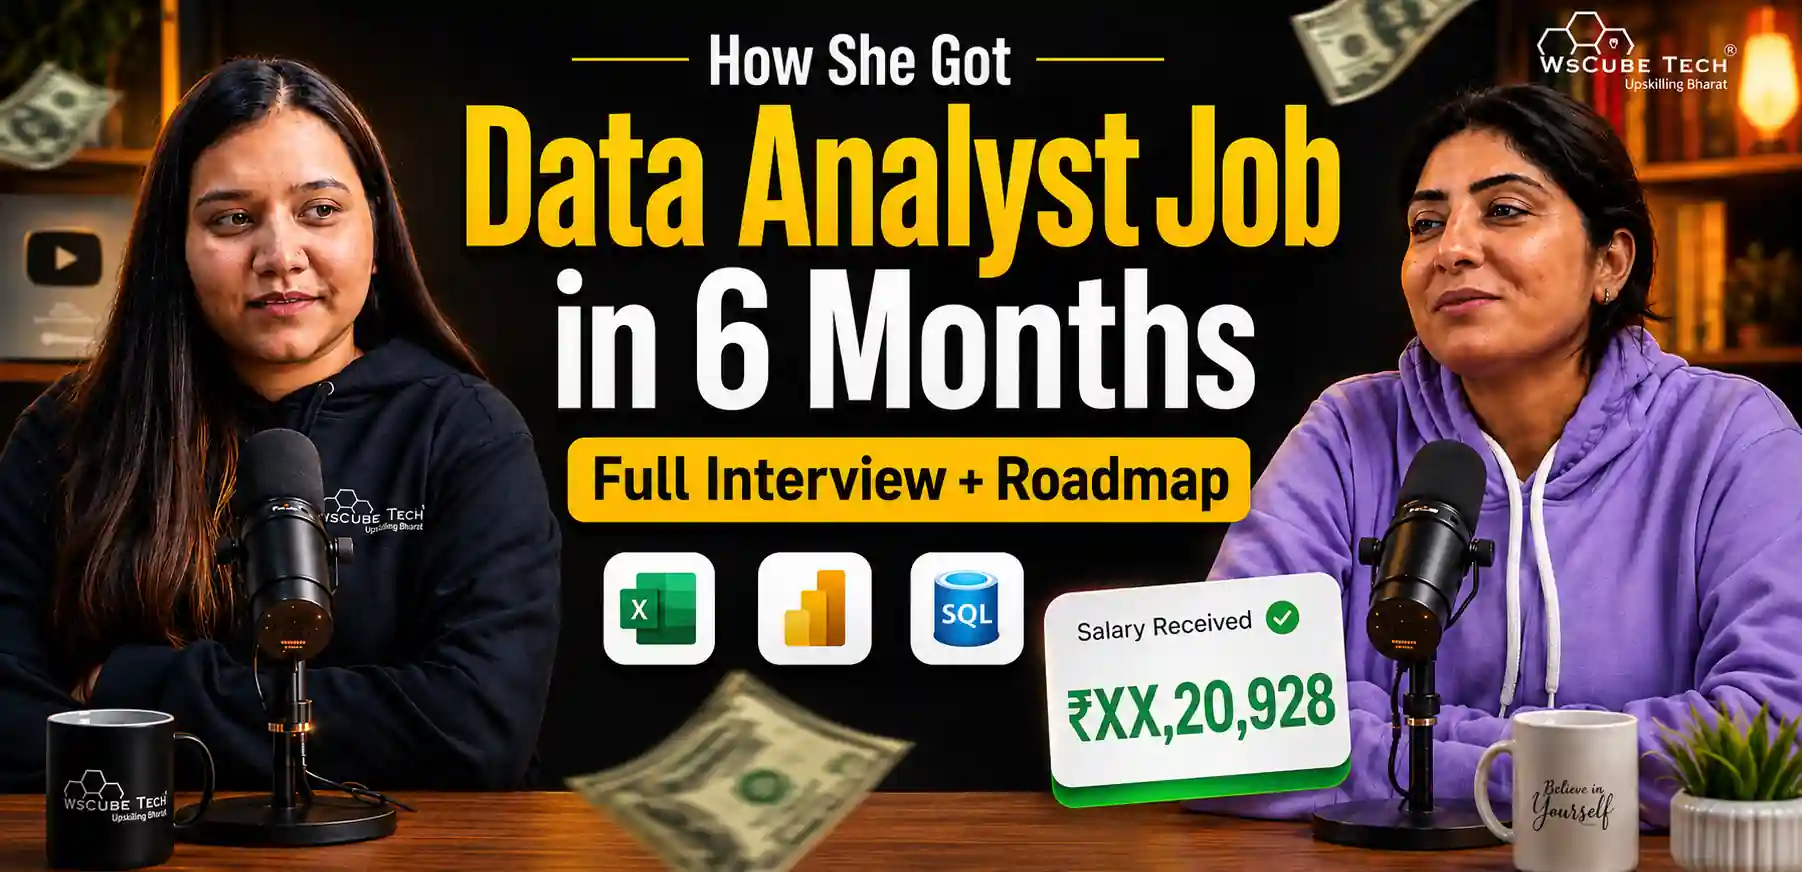
Career transitions often require more than a new qualification. They demand practical skills, consistent effort, confidence, and the willingness to keep learning after facing setbacks.
Raman's journey from a .NET programmer to a Project Manager in MIS is an example of how structured learning and hands-on practice can help professionals move into data analytics. With an M.Tech in Artificial Intelligence and Data Science, she already had an academic foundation. However, she needed practical experience in tools such as Excel, SQL, Power BI, and Power Query.
Through the WsCube Tech Data Analytics course, Raman learned how to work with real-world data, build projects, prepare for interviews, present her skills on LinkedIn, and use AI tools responsibly. Her efforts eventually helped her secure a Project Manager MIS position in a semi-government organization.
Key Highlights of the Interview
In this podcast, Raman shares:
- How she moved from a .NET programmer role to Project Manager MIS
- Why she shifted from traditional programming to the data side of technology
- What her M.Tech gave her, and what it left out
- Which tools mattered most in interviews and how they were weighted
- Her complete job search, including the offer she turned down
- How she used AI for project ideas, datasets, and SQL practice
- Why she set a 15-minute rule before asking AI for help
- How mock interviews with classmates built her confidence
- Her advice on applying even when your English is not perfect
Watch the Full Interview
Prefer watching the video? Catch Raman's full story below:
Student Overview
| Category | Details |
| Student | Raman |
| Educational qualification | M.Tech in Artificial Intelligence and Data Science, 2024 |
| Previous role | .NET Programmer |
| Course joined | WsCube Tech Data Analytics Course |
| Main skills developed | Excel, SQL, Power BI, Power Query, and Python |
| Strongest technical skill | SQL |
| Most challenging tool | Power BI |
| Study routine | Around 3 to 4 hours daily |
| Selected role | Project Manager MIS in a semi-government organization |
| Future goal | Build a career in Data Science |
Raman's Educational Background
Raman completed her M.Tech in Artificial Intelligence and Data Science from Indira Gandhi Delhi Technical University, Delhi, in 2024. Before moving toward analytics, she worked as a .NET programmer.
What her background gave her
Her programming work built a strong base in:
- Logic and problem-solving.
- Databases.
- Functions.
During her M.Tech, she also studied artificial intelligence, data science, and Python.
What was missing
Most of this knowledge stayed theoretical. She knew data had to be cleaned before analysis or model building. But she did not know how the full workflow actually worked.
She had very little hands-on practice in:
- Data cleaning.
- Data visualization.
- Dashboard creation.
- Data interpretation.
What she wanted to learn
- Clean and transform raw data.
- Write queries for business analysis.
- Create meaningful dashboards.
- Identify patterns and insights.
- Present findings to stakeholders.
- Explain projects during interviews.
- Connect technical work with business requirements.
This gap between theory and practice is what led her to a structured data analytics course. [02:20]
Recommended Professional Certificates
Data Analytics Course with Gen AI
Data Science Course with Internship & Placement Support
Why Raman Chose Data Analytics and WsCube Tech
Raman became interested in data and artificial intelligence as these fields grew. She was also watching AI tools become better at generating code and wondered how much value traditional programming skills would hold in the years ahead.
Her M.Tech gave her a foundation in AI and data science. What she wanted next was something more practical and job-oriented.
Data analytics felt like a good fit because it let her:
- Use her programming background for business problem-solving.
- Move from writing code to working with data.
- Follow a path with steady job demand.
Along the way, she also noticed that companies look for more than coding ability. They value people who can:
- Understand data.
- Create reports.
- Explain trends.
- Support better decisions.
Why WsCube Tech
Raman discovered WsCube Tech through a free tutorial on building a pizza sales project using SQL. It attracted her because it showed how to work on a practical project and present it professionally.
She had not shared projects on LinkedIn before. After publishing this one, she gained confidence and understood the value of showing practical work publicly.
She then explored the course further, spoke with the HR team, and enrolled in the Data Analytics program. It covered:
- Excel, SQL, Power Query, Power BI, and Python.
- Data cleaning, data visualization, and project development.
- Interview preparation, mock interviews, and LinkedIn portfolio building.
How the WsTech Cube’s Data Analytics Course Helped Raman
1. Turning theory into practice
Raman knew data preprocessing was necessary. She did not know how to identify errors, handle missing values, or transform data for analysis.
The course gave her datasets and the full workflow:
- Obtain or create the dataset.
- Inspect the data.
- Clean and transform it.
- Analyze it using Excel or SQL.
- Create visualizations.
- Build a dashboard.
- Present business insights.
Working through this repeatedly made her knowledge useful in interviews.
2. Strengthening SQL
SQL became her strongest tool. She practiced:
- Joins, aggregations, and subqueries.
- Ranking functions, RANK(), and DENSE_RANK().
- Window functions.
- Revenue analysis and financial calculations.
- Data management queries.
Her .NET background already covered databases and logic. The course taught her to apply SQL to analytics and business questions.
3. Building a project portfolio
She built several projects and published them on LinkedIn. In her final interview, the panel asked to see them. She opened her profile and walked through:
- The purpose of each project.
- The data used and how it was cleaned.
- The queries written and dashboards created.
- The insights and business value.
That gave the panel proof, not claims. A portfolio closes the gap between qualifications and the practical skills employers want.
4. Improving interview confidence
Raman felt nervous early on because she had little hands-on experience with real datasets.
She attended around 10 to 15 interviews. Even the rejections were useful: she noted every question she could not answer, studied it afterward, and was ready for it next time.
Knowledge and confidence grew together.
make it a bit different amd mareting cetric
Ready to Make the Same Switch as Raman?
Raman was a .NET programmer with an M.Tech and almost no hands-on analytics experience. Today she leads a team of four to five people as a Project Manager MIS. What changed was not another degree. It was practical skills, real projects, and structured interview preparation.
The WsCube Tech Data Analytics Course is built to take you down the same path:
- Learn the tools that get you hired: Excel, SQL, Power Query, Power BI, and Python.
- Build a portfolio, not just notes: Real projects you can publish on LinkedIn and walk an interview panel through.
- Walk into interviews prepared: Mock interviews, technical practice, and peer learning groups.
- Get placement support: Access to hiring opportunities once you are job ready.
Raman started with theory and no practical exposure. Six months later she was selected from 55 applicants.
Tools Raman Used
Raman used a combination of analytics, programming, portfolio, and AI tools during her learning journey.
| Tool | How Raman used it |
| Excel | Data cleaning, formulas, calculations, pivot tables, analysis, and reports |
| SQL | Database querying, joins, ranking, window functions, revenue analysis, and data management |
| Power BI | Dashboard creation, data modeling, visualization, calculated measures, and reporting |
| Python | Programming, data analysis, automation, and preparation for data science |
| Power Query | Data transformation, reshaping, combining datasets, and cleaning |
| Publishing projects, building a portfolio, and presenting work to recruiters | |
| ChatGPT and AI tools | Project ideas, datasets, SQL practice, interview questions, explanations, and research |
| .NET | Previous programming background that supported her logical and database skills |
Upcoming Masterclass
Attend our live classes led by experienced and desiccated instructors of Wscube Tech.

How Raman Used AI
Raman used ChatGPT as a study assistant, not as a shortcut. It supported four parts of her learning.
1. Starting a project
Two problems come up before any analysis begins: what to build and what data to use.
- Ideas: She asked AI for project concepts and business questions on topics that interested her, which turned a vague interest into a defined project.
- Datasets: AI pointed her to platforms such as Kaggle and helped her judge what kind of data would suit a given project.
- Sample data: When nothing suitable existed, she had AI generate datasets with rows and columns for practice in Excel, SQL, and Power BI
One caution: AI-generated data needs checking. Raman reviewed the columns, values, formats, and business logic before using any of it.
2. Practicing SQL
She used ChatGPT to create practice questions and compare different query solutions, covering:
- Ranking employees or products.
- Finding the second-highest value.
- Using RANK() and DENSE_RANK().
- Applying window functions.
- Calculating revenue.
- Filtering and grouping data.
- Solving business problems through SQL.
This mattered because SQL was the largest part of her technical interviews.
3. Preparing for interviews
She generated likely questions across Excel, SQL, Power BI, data cleaning, data visualization, business analysis, and project explanations.
She also fed back questions from interviews she had already attended, so she could prepare stronger answers for the next one.
4. Understanding difficult concepts
When a topic did not click, she asked for explanations, examples, and alternative approaches.
She did not treat those answers as a substitute for practice. She applied each explanation to a project or exercise to confirm she had actually understood it.
Raman's 15-Minute AI Rule
At first, Raman would ask ChatGPT for help the moment she hit a difficult problem. She later realized this was weakening her ability to think independently.
So she set a simple rule for herself:
Try to solve the problem on your own for 15 minutes before asking AI. [25:52]
Why it worked:
- Kept her problem-solving sharp: She still had to think through the problem first.
- Made her questions better: After attempting it herself, she knew exactly where she was stuck.
- Made the answers clearer: She understood the response because she already understood the problem.
Mock Interviews and Peer Learning
Raman created a mock-interview group with several classmates. The group worked collaboratively, with each student contributing a different strength. Some students were stronger in Excel, while Raman helped others with SQL. Other classmates had more experience with Power BI and dashboards.
The group exchanged:
- Interview questions.
- SQL problems.
- Excel exercises.
- Power BI tasks.
- Project ideas.
- Feedback on answers.
- Job opportunities.
This peer-learning environment helped Raman recognize her weaknesses and improve them. It also made the learning process less isolating. The students continued communicating after completing the course. They still share job openings, discuss interview experiences, and support one another professionally.
The Most Difficult Tool: Power BI
Raman found Power BI harder than SQL and Python. The challenge was not the formulas. She was comfortable creating measures and using logical functions.
The hard part was design: building a dashboard that looked good and was easy to understand.
She had to learn how to:
- Choose the right chart.
- Arrange visuals logically.
- Select suitable colors.
- Avoid overcrowding the dashboard.
- Highlight the most important information.
- Present insights in a business-friendly way.
Classmates with stronger Power BI design skills helped her improve. In return, she contributed her SQL knowledge to the group.
The takeaway: analytics needs both technical and communication skills. A technically correct dashboard is still ineffective if the information is not presented clearly.
Raman's Job Search Strategy
Her search had two fixed conditions:
- Location. Stay in or around Chandigarh; no relocation.
- Salary. Match or beat her existing package.
Most placement opportunities were in Delhi or Gurgaon, so she widened her approach:
- Applied to course placement opportunities.
- Searched independently.
- Applied to local organizations.
- Explored offline opportunities.
- Attended interviews consistently.
How it played out:
- Offer 1: Data analyst, around Rs 40,000 per month. She declined it because it was below her existing salary.
- Offer 2: A higher-paying role, but she was not selected.
- Offer 3: Project Manager MIS at a semi-government organization. One opening, around 55 applicants.
Many applicants had 10 or 15 years of experience, which initially made her doubt her chances. She still performed confidently. Her interview ran around 27 minutes, longer than most others she had attended. After 20 to 25 days of the process, she got the confirmation.
Explore Our Data Related Courses
| Data Analytics Course | Live Internship + 100% Job Support |
| Business Analytics Course | Live Internship + 100% Job Support |
| Data Science Course | Live Internship + 100% Job Support |
Raman's New Role
Project Manager MIS was her first position with formal leadership responsibility. She had always worked under managers before. Now four or five people would report to her.
The role also involved data and Power BI, so her analytics training applied directly. She planned to keep practicing Power BI and improving her reporting after joining.
The move gave her a chance to:
- Lead a team.
- Work with data.
- Manage projects.
- Create reports.
- Support organizational decision-making.
- Apply her analytics knowledge professionally.
Communication Skills and Interview Confidence
Raman understood English but sometimes felt uncomfortable speaking it confidently.
What her interviews taught her:
- Technical ability carries real weight: Candidates get asked to write SQL queries, solve problems on a dataset, build a dashboard, or explain a project.
- Doing those tasks well matters: Minor communication limitations may not automatically prevent selection.
- Communication still counts: She kept working on it alongside her technical skills.
Her advice: do not reject yourself because your English is not perfect. Keep improving it while you apply and demonstrate what you can actually do.
Raman's Study Routine
- Daily hours: Three to four.
- Preferred slot: Around 4:30 a.m. to 6:30 a.m.
- Plus: Daily classes and project work in whatever time was left.
She did not rely on classroom sessions alone. Outside class, she revised concepts, practiced tools, built projects, and prepared for interviews. That consistency is what built her confidence.
Raman's Future Goals
Raman does not plan to stop learning now that she has the job. Her long-term goal is data science.
Her plan:
- Keep working in analytics.
- Study data science alongside her job.
- Continue projects with a former teacher on AI and large language models.
Instead of abandoning her current path, she is using analytics as the foundation for a move into data science and AI.
From Preparation to Selection: Raman’s Interview with Ayushi
Ayushi: Can you tell us about your background and journey?
Raman: I completed my M.Tech in Artificial Intelligence and Data Science in 2024. Before moving into data analytics, I worked as a .NET programmer. I became interested in data analysis, particularly data cleaning and summarization. After discovering WsCube Tech through a SQL project tutorial, I enrolled in the course and began developing practical analytics skills.
Ayushi: Why did you choose Artificial Intelligence and Data Science for your M.Tech?
Raman: I chose it because artificial intelligence, ChatGPT, and large language models were becoming increasingly important. I was concerned that traditional programming skills might become less valuable as AI tools became capable of generating code. So I became interested in the data side of technology, including how data is managed, structured, manipulated, and analyzed.
Ayushi: How much did your degree help you get the job?
Raman: My degree helped me qualify for job opportunities and pass the initial screening process. But practical knowledge and interview performance played a more important role in the final selection. In my view, a degree can help a candidate enter the recruitment process, but practical skills help the candidate succeed during the interview.
Ayushi: How much did you learn about analytics and data science during your degree?
Raman: During my M.Tech, I learned Python and several theoretical concepts related to artificial intelligence and data science. But I did not receive sufficient practical exposure to data cleaning, visualization, dashboard creation, and data interpretation. The Data Analytics course helped me understand how these concepts are applied to real-world projects.
Ayushi: Which tools helped you the most during the interview?
Raman: SQL helped me the most. I would estimate that SQL represented approximately 40% of the technical discussion.
| Skill | Approximate interview focus |
| SQL | 40% |
| Excel | 30% |
| Power BI and dashboards | 20% |
| Other areas | 10% |
The interview included questions related to ranking queries, dense-ranking queries, and window functions.
Ayushi: How did the course projects help you?
Raman: The projects helped me build a portfolio and demonstrate my practical skills. During my final interview, the panel asked me to show the projects I had completed. I opened my LinkedIn profile and explained the data, tools, cleaning process, analysis, and dashboards used in my projects. This gave the interviewers direct evidence of my ability to work with data and present project outcomes.
Ayushi: How did mock interviews help you?
Raman: My classmates and I formed a mock-interview group in which each student contributed according to their individual strengths. The group helped me improve my SQL knowledge, understand interview expectations, practice answering technical questions, and become more confident during interviews.
Ayushi: Which tool was the most difficult for you?
Raman: I found Power BI the most difficult, particularly the design and presentation of dashboards. I was comfortable working with calculations and logical functions, but I initially struggled with chart selection, color choices, dashboard layout, and visual storytelling. Support from my classmates helped me gradually improve my Power BI skills.
Ayushi: Was your previous .NET experience connected to data analytics?
Raman: SQL created the strongest connection between my previous programming experience and data analytics. My experience with tables, stored procedures, functions, and data manipulation helped me understand SQL more easily. Excel and Power BI were newer areas for me because they had not been part of my regular .NET work.
Ayushi: How did you apply for jobs?
Raman: I applied through course placement opportunities and also searched for jobs independently. Because I wanted to remain in Chandigarh, I explored local and offline opportunities in addition to applying online. My location preference influenced the types of roles and organizations I considered.
Ayushi: How many interviews did you attend?
Raman: I attended approximately 10 to 15 analytics-related interviews. I treated every interview as a learning opportunity. Whenever I was unable to answer a question, I studied the topic afterward and prepared it for future interviews.
Ayushi: How did you handle nervousness during interviews?
Raman: I initially felt nervous because I lacked practical knowledge and was not fully confident about answering analytics-related questions. As I completed more projects and attended additional interviews, my confidence improved. I found that stronger preparation and hands-on practice helped reduce my anxiety.
Ayushi: How did independent projects help you?
Raman: Independent projects helped me learn how to find data, research topics, define project requirements, and solve problems without relying entirely on classroom instructions. I used AI tools to identify project ideas and datasets, but I also focused on developing my own analytical and problem-solving abilities.
Ayushi: How many hours did you spend learning?
Raman: I studied approximately three to four hours every day during the course. I preferred studying early in the morning, from around 4:30 a.m. to 6:30 a.m. I also dedicated additional time to attending classes, revising concepts, and completing projects.
Ayushi: What are your future career goals?
Raman: I plan to move toward data science. I intend to continue working in analytics while studying data science and gaining experience in artificial intelligence and large language models. This will allow me to build professional experience while preparing for a future transition into data science.
Key Lessons from Raman’s Journey
Raman’s journey offers several valuable lessons for aspiring data analysts:
- A degree can help a candidate meet eligibility requirements, but practical skills are crucial during interviews.
- SQL can be especially valuable for roles involving databases, reporting, and management information systems.
- Projects become more effective when they are presented clearly through a portfolio.
- LinkedIn can help candidates showcase their work to recruiters and interviewers.
- Mock interviews can help learners identify weaknesses and improve confidence.
- Peer learning can make difficult tools easier to understand.
- Power BI requires both technical knowledge and visual communication skills.
- Every interview can provide useful preparation for the next opportunity.
- Communication skills should be improved, but imperfect English should not prevent candidates from applying for jobs.
- AI tools can support project ideation, dataset creation, SQL practice, and interview preparation.
- Learners should attempt problems independently before asking AI for solutions.
- Consistent daily practice can be more effective than irregular, intensive study.
- Career transitions become easier when learners work on realistic projects.
- Learning should continue even after a candidate secures a job.
Start Your Own Data Analytics Journey
Raman had the degree. What she lacked was practice. Once she had real projects and a portfolio to show, the offers followed.
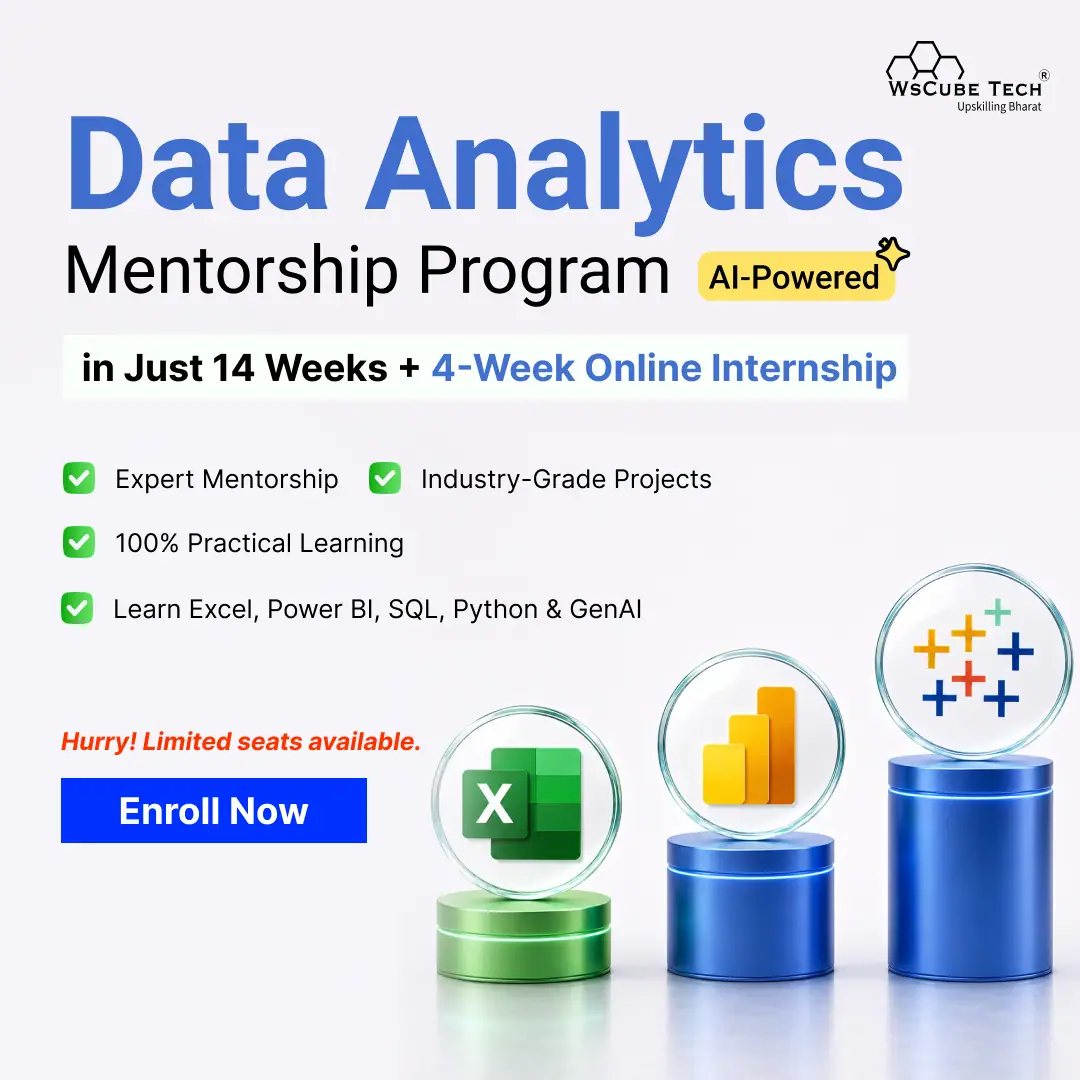
The WsCube Tech's Data Analytics Course gives you exactly that:
- Excel, SQL, Power BI, Tableau, Python, and GenAI
- 10 industry projects and a 4-week internship on real business data
- 1:1 mock interviews and one year of placement support
280+ students placed. 90% median hike. ₹18 LPA highest package.
Enroll Now!
Join Our On-Campus Data Analytics Course



Leave a comment
Your email address will not be published. Required fields are marked *Comments (0)
No comments yet.